Approche quantitative de la fonction de nourricerie jouée par les ...
Approche quantitative de la fonction de nourricerie jouée par les ...
Approche quantitative de la fonction de nourricerie jouée par les ...

You also want an ePaper? Increase the reach of your titles
YUMPU automatically turns print PDFs into web optimized ePapers that Google loves.
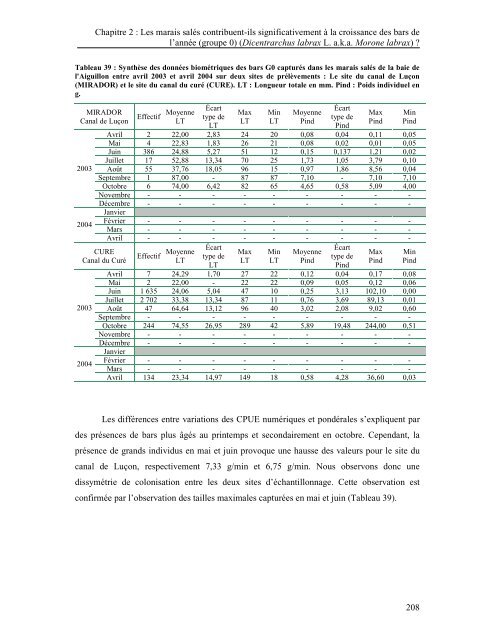
Chapitre 2 : Les marais salés contribuent-ils significativement à <strong>la</strong> croissance <strong>de</strong>s bars <strong>de</strong><br />
l’année (groupe 0) (Dicentrarchus <strong>la</strong>brax L. a.k.a. Morone <strong>la</strong>brax) ?<br />
Tableau 39 : Synthèse <strong>de</strong>s données biométriques <strong>de</strong>s bars G0 capturés dans <strong>les</strong> marais salés <strong>de</strong> <strong>la</strong> baie <strong>de</strong><br />
l'Aiguillon entre avril 2003 et avril 2004 sur <strong>de</strong>ux sites <strong>de</strong> prélèvements : Le site du canal <strong>de</strong> Luçon<br />
(MIRADOR) et le site du canal du curé (CURE). LT : Longueur totale en mm. Pind : Poids individuel en<br />
g.<br />
MIRADOR<br />
Canal <strong>de</strong> Luçon<br />
2003<br />
2004<br />
Effectif Moyenne<br />
LT<br />
Écart<br />
type <strong>de</strong><br />
LT<br />
Max<br />
LT<br />
Min<br />
LT<br />
Moyenne<br />
Pind<br />
Écart<br />
type <strong>de</strong><br />
Pind<br />
Max<br />
Pind<br />
Min<br />
Pind<br />
Avril 2 22,00 2,83 24 20 0,08 0,04 0,11 0,05<br />
Mai 4 22,83 1,83 26 21 0,08 0,02 0,01 0,05<br />
Juin 386 24,88 5,27 51 12 0,15 0,137 1,21 0,02<br />
Juillet 17 52,88 13,34 70 25 1,73 1,05 3,79 0,10<br />
Août 55 37,76 18,05 96 15 0,97 1,86 8,56 0,04<br />
Septembre 1 87,00 - 87 87 7,10 - 7,10 7,10<br />
Octobre 6 74,00 6,42 82 65 4,65 0,58 5,09 4,00<br />
Novembre - - - - - - - - -<br />
Décembre<br />
Janvier<br />
- - - - - - - - -<br />
Février - - - - - - - - -<br />
Mars - - - - - - - - -<br />
Avril - - - - - - - - -<br />
CURE<br />
Canal du Curé<br />
2003<br />
2004<br />
Effectif Moyenne<br />
LT<br />
Écart<br />
type <strong>de</strong><br />
LT<br />
Max<br />
LT<br />
Min<br />
LT<br />
Moyenne<br />
Pind<br />
Écart<br />
type <strong>de</strong><br />
Pind<br />
Max<br />
Pind<br />
Min<br />
Pind<br />
Avril 7 24,29 1,70 27 22 0,12 0,04 0,17 0,08<br />
Mai 2 22,00 - 22 22 0,09 0,05 0,12 0,06<br />
Juin 1 635 24,06 5,04 47 10 0,25 3,13 102,10 0,00<br />
Juillet 2 702 33,38 13,34 87 11 0,76 3,69 89,13 0,01<br />
Août 47 64,64 13,12 96 40 3,02 2,08 9,02 0,60<br />
Septembre - - - - - - - - -<br />
Octobre 244 74,55 26,95 289 42 5,89 19,48 244,00 0,51<br />
Novembre - - - - - - - - -<br />
Décembre<br />
Janvier<br />
- - - - - - - - -<br />
Février - - - - - - - - -<br />
Mars - - - - - - - - -<br />
Avril 134 23,34 14,97 149 18 0,58 4,28 36,60 0,03<br />
Les différences entre variations <strong>de</strong>s CPUE numériques et pondéra<strong>les</strong> s’expliquent <strong>par</strong><br />
<strong>de</strong>s présences <strong>de</strong> bars plus âgés au printemps et secondairement en octobre. Cependant, <strong>la</strong><br />
présence <strong>de</strong> grands individus en mai et juin provoque une hausse <strong>de</strong>s valeurs pour le site du<br />
canal <strong>de</strong> Luçon, respectivement 7,33 g/min et 6,75 g/min. Nous observons donc une<br />
dissymétrie <strong>de</strong> colonisation entre <strong>les</strong> <strong>de</strong>ux sites d’échantillonnage. Cette observation est<br />
confirmée <strong>par</strong> l’observation <strong>de</strong>s tail<strong>les</strong> maxima<strong>les</strong> capturées en mai et juin (Tableau 39).<br />
208