Scarica il fascicolo completo - Rdes.It
Scarica il fascicolo completo - Rdes.It
Scarica il fascicolo completo - Rdes.It

Create successful ePaper yourself
Turn your PDF publications into a flip-book with our unique Google optimized e-Paper software.
92 Carmine Zoccali<br />
Figure n. 1 shows how the ratio E/TA is able to completely split bankrupt<br />
from non-bankrupt firms, because its mean values over the five years do not<br />
overlap and this can help us to distinguish if a firm w<strong>il</strong>l go out of business within<br />
one year.<br />
But going deeper, the results show the lowest degree of direct correlation<br />
existing between the level of the ratio E/TA set by the <strong>It</strong>alian watchdog committee<br />
and the likelihood of fa<strong>il</strong>ure.<br />
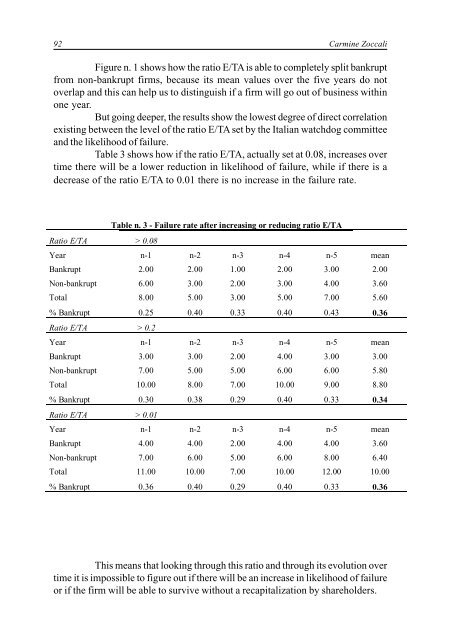
Table 3 shows how if the ratio E/TA, actually set at 0.08, increases over<br />
time there w<strong>il</strong>l be a lower reduction in likelihood of fa<strong>il</strong>ure, wh<strong>il</strong>e if there is a<br />
decrease of the ratio E/TA to 0.01 there is no increase in the fa<strong>il</strong>ure rate.<br />
Table n. 3 - Fa<strong>il</strong>ure rate after increasing or reducing ratio E/TA<br />
Ratio E/TA > 0.08<br />
Year n-1 n-2 n-3 n-4 n-5 mean<br />
Bankrupt 2.00 2.00 1.00 2.00 3.00 2.00<br />
Non-bankrupt 6.00 3.00 2.00 3.00 4.00 3.60<br />
Total 8.00 5.00 3.00 5.00 7.00 5.60<br />
% Bankrupt 0.25 0.40 0.33 0.40 0.43 0.36<br />
Ratio E/TA > 0.2<br />
Year n-1 n-2 n-3 n-4 n-5 mean<br />
Bankrupt 3.00 3.00 2.00 4.00 3.00 3.00<br />
Non-bankrupt 7.00 5.00 5.00 6.00 6.00 5.80<br />
Total 10.00 8.00 7.00 10.00 9.00 8.80<br />
% Bankrupt 0.30 0.38 0.29 0.40 0.33 0.34<br />
Ratio E/TA > 0.01<br />
Year n-1 n-2 n-3 n-4 n-5 mean<br />
Bankrupt 4.00 4.00 2.00 4.00 4.00 3.60<br />
Non-bankrupt 7.00 6.00 5.00 6.00 8.00 6.40<br />
Total 11.00 10.00 7.00 10.00 12.00 10.00<br />
% Bankrupt 0.36 0.40 0.29 0.40 0.33 0.36<br />
This means that looking through this ratio and through its evolution over<br />
time it is impossible to figure out if there w<strong>il</strong>l be an increase in likelihood of fa<strong>il</strong>ure<br />
or if the firm w<strong>il</strong>l be able to survive without a recapitalization by shareholders.