Rapporto sulle biotecnologie in Italia 2010 - Farmindustria
Rapporto sulle biotecnologie in Italia 2010 - Farmindustria
Rapporto sulle biotecnologie in Italia 2010 - Farmindustria

You also want an ePaper? Increase the reach of your titles
YUMPU automatically turns print PDFs into web optimized ePapers that Google loves.
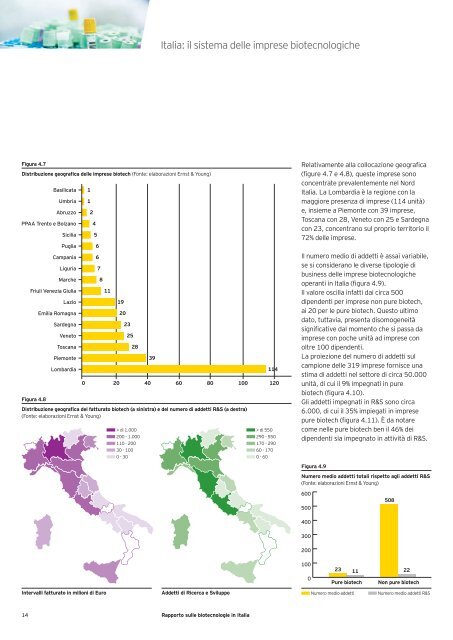
Figura 4.7<br />
Distribuzione geografica delle imprese biotech (Fonte: elaborazioni Ernst & Young)<br />
Basilicata<br />
Umbria<br />
Abruzzo<br />
PPAA Trento e Bolzano<br />
Sicilia<br />
Puglia<br />
Campania<br />
Liguria<br />
Marche<br />
Friuli Venezia Giulia<br />
Lazio<br />
Emilia Romagna<br />
Sardegna<br />
Veneto<br />
Toscana<br />
Piemonte<br />
Lombardia<br />
1<br />
1<br />
2<br />
4<br />
5<br />
6<br />
6<br />
7<br />
8<br />
11<br />
19<br />
20<br />
23<br />
25<br />
28<br />
Figura 4.8<br />
Distribuzione geografica del fatturato biotech (a s<strong>in</strong>istra) e del numero di addetti R&S (a destra)<br />
(Fonte: elaborazioni Ernst & Young)<br />
14 <strong>Rapporto</strong> <strong>sulle</strong> <strong>biotecnologie</strong> <strong>in</strong> <strong>Italia</strong><br />
39<br />
<strong>Italia</strong>: il sistema delle imprese biotecnologiche<br />
0 20 40 60 80 100 120<br />
n > di 1.000<br />
n 200 - 1.000<br />
n 110 - 200<br />
n 30 - 100<br />
n 0 - 30<br />
Intervalli fatturato <strong>in</strong> milioni di Euro Addetti di Ricerca e Sviluppo<br />
114<br />
n > di 550<br />
n 290 - 550<br />
n 170 - 290<br />
n 60 - 170<br />
n 0 - 60<br />
Relativamente alla collocazione geografica<br />
(figure 4.7 e 4.8), queste imprese sono<br />
concentrate prevalentemente nel Nord<br />
<strong>Italia</strong>. La Lombardia è la regione con la<br />
maggiore presenza di imprese (114 unità)<br />
e, <strong>in</strong>sieme a Piemonte con 39 imprese,<br />
Toscana con 28, Veneto con 25 e Sardegna<br />
con 23, concentrano sul proprio territorio il<br />
72% delle imprese.<br />
Il numero medio di addetti è assai variabile,<br />
se si considerano le diverse tipologie di<br />
bus<strong>in</strong>ess delle imprese biotecnologiche<br />
operanti <strong>in</strong> <strong>Italia</strong> (figura 4.9).<br />
Il valore oscilla <strong>in</strong>fatti dai circa 500<br />
dipendenti per imprese non pure biotech,<br />
ai 20 per le pure biotech. Questo ultimo<br />
dato, tuttavia, presenta disomogeneità<br />
significative dal momento che si passa da<br />
imprese con poche unità ad imprese con<br />
oltre 100 dipendenti.<br />
La proiezione del numero di addetti sul<br />
campione delle 319 imprese fornisce una<br />
stima di addetti nel settore di circa 50.000<br />
unità, di cui il 9% impegnati <strong>in</strong> pure<br />
biotech (figura 4.10).<br />
Gli addetti impegnati <strong>in</strong> R&S sono circa<br />
6.000, di cui il 35% impiegati <strong>in</strong> imprese<br />
pure biotech (figura 4.11). È da notare<br />
come nelle pure biotech ben il 46% dei<br />
dipendenti sia impegnato <strong>in</strong> attività di R&S.<br />
Figura 4.9<br />
Numero medio addetti totali rispetto agli addetti R&S<br />
(Fonte: elaborazioni Ernst & Young)<br />
600<br />
500<br />
400<br />
300<br />
200<br />
100<br />
0<br />
23<br />
11<br />
508<br />
22<br />
Pure biotech Non pure biotech<br />
n Numero medio addetti n Numero medio addetti R&S