Rapporto sulle biotecnologie in Italia 2010 - Farmindustria
Rapporto sulle biotecnologie in Italia 2010 - Farmindustria
Rapporto sulle biotecnologie in Italia 2010 - Farmindustria

You also want an ePaper? Increase the reach of your titles
YUMPU automatically turns print PDFs into web optimized ePapers that Google loves.
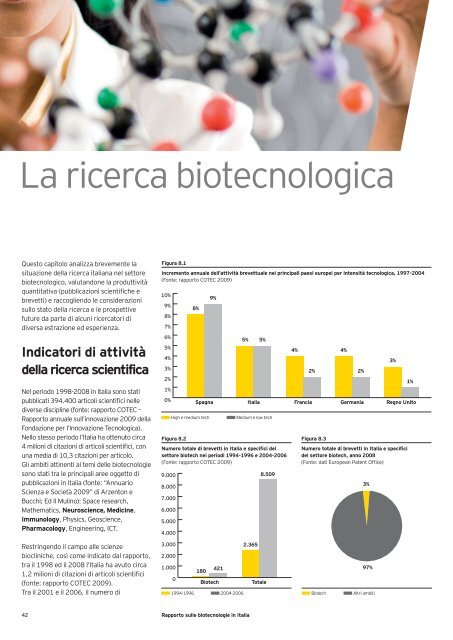
La ricerca biotecnologica<br />
Questo capitolo analizza brevemente la<br />
situazione della ricerca italiana nel settore<br />
biotecnologico, valutandone la produttività<br />
quantitativa (pubblicazioni scientifiche e<br />
brevetti) e raccogliendo le considerazioni<br />
sullo stato della ricerca e le prospettive<br />
future da parte di alcuni ricercatori di<br />
diversa estrazione ed esperienza.<br />
Indicatori di attività<br />
della ricerca scientifica<br />
Nel periodo 1998-2008 <strong>in</strong> <strong>Italia</strong> sono stati<br />
pubblicati 394.400 articoli scientifici nelle<br />
diverse discipl<strong>in</strong>e (fonte: rapporto COTEC –<br />
<strong>Rapporto</strong> annuale sull’<strong>in</strong>novazione 2009 della<br />
Fondazione per l’Innovazione Tecnologica).<br />
Nello stesso periodo l’<strong>Italia</strong> ha ottenuto circa<br />
4 milioni di citazioni di articoli scientifici, con<br />
una media di 10,3 citazioni per articolo.<br />
Gli ambiti att<strong>in</strong>enti ai temi delle <strong>biotecnologie</strong><br />
sono stati tra le pr<strong>in</strong>cipali aree oggetto di<br />
pubblicazioni <strong>in</strong> <strong>Italia</strong> (fonte: “Annuario<br />
Scienza e Società 2009” di Arzenton e<br />
Bucchi; Ed Il Mul<strong>in</strong>o): Space research,<br />
Mathematics, Neuroscience, Medic<strong>in</strong>e,<br />
Immunology, Physics, Geoscience,<br />
Pharmacology, Eng<strong>in</strong>eer<strong>in</strong>g, ICT.<br />
Restr<strong>in</strong>gendo il campo alle scienze<br />
biocl<strong>in</strong>iche, così come <strong>in</strong>dicato dal rapporto,<br />
tra il 1998 ed il 2008 l’<strong>Italia</strong> ha avuto circa<br />
1,2 milioni di citazioni di articoli scientifici<br />
(fonte: rapporto COTEC 2009).<br />
Tra il 2001 e il 2006, il numero di<br />
Spagna<br />
n High e medium tech n Medium e low tech<br />
Biotech<br />
42 <strong>Rapporto</strong> <strong>sulle</strong> <strong>biotecnologie</strong> <strong>in</strong> <strong>Italia</strong><br />
Figura 8.1<br />
Incremento annuale dell’attività brevettuale nei pr<strong>in</strong>cipali paesi europei per <strong>in</strong>tensità tecnologica, 1997-2004<br />
(Fonte: rapporto COTEC 2009)<br />
10%<br />
9%<br />
8%<br />
7%<br />
6%<br />
5%<br />
4%<br />
3%<br />
2%<br />
1%<br />
0%<br />
9.000<br />
8.000<br />
7.000<br />
6.000<br />
5.000<br />
4.000<br />
3.000<br />
2.000<br />
1.000<br />
0<br />
8%<br />
180<br />
9%<br />
5%<br />
<strong>Italia</strong><br />
Figura 8.2<br />
Numero totale di brevetti <strong>in</strong> <strong>Italia</strong> e specifici del<br />
settore biotech nei periodi 1994-1996 e 2004-2006<br />
(Fonte: rapporto COTEC 2009)<br />
421<br />
2.365<br />
5%<br />
Totale<br />
8.509<br />
4% 4%<br />
2% 2%<br />
Francia Germania Regno Unito<br />
n 1994-1996 n 2004-2006 n Biotech n Altri ambiti<br />
3%<br />
97%<br />
3%<br />
Figura 8.3<br />
Numero totale di brevetti <strong>in</strong> <strong>Italia</strong> e specifici<br />
del settore biotech, anno 2008<br />
(Fonte: dati European Patent Office)<br />
1%