
You also want an ePaper? Increase the reach of your titles
YUMPU automatically turns print PDFs into web optimized ePapers that Google loves.
PANORAMA DO MERCADO IMOBILIÁRIO DO RIO DE JANEIRO <strong>2010</strong><br />
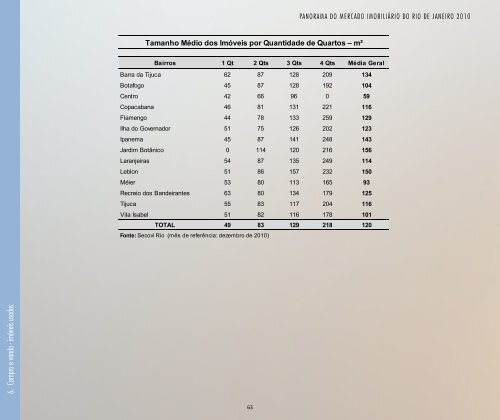
Tamanho Médio <strong>do</strong>s Imóveis por Quantida<strong>de</strong> <strong>de</strong> Quartos – m²<br />
Bairros 1 Qt 2 Qts 3 Qts 4 Qts Média Geral<br />
Barra da Tijuca 62 87 128 209 134<br />
Botafogo 45 87 128 192 104<br />
Centro 42 66 96 0 59<br />
Copacabana 46 81 131 221 116<br />
Flamengo 44 78 133 259 129<br />
Ilha <strong>do</strong> Governa<strong>do</strong>r 51 75 126 202 123<br />
Ipanema 45 87 141 248 143<br />
Jardim Botânico 0 114 120 216 156<br />
Laranjeiras 54 87 135 249 114<br />
Leblon 51 86 157 232 150<br />
Méier 53 80 113 165 93<br />
Recreio <strong>do</strong>s Ban<strong>de</strong>irantes 63 80 134 179 125<br />
Tijuca 55 83 117 204 116<br />
Vila Isabel 51 82 116 178 101<br />
TOTAL 49 83 129 218 120<br />
Fonte: Secovi <strong>Rio</strong> (mês <strong>de</strong> referência: <strong>de</strong>zembro <strong>de</strong> <strong>2010</strong>)<br />
6. Compra e venda - imóveis usa<strong>do</strong>s<br />
63