VGB POWERTECH 10 (2019)
VGB PowerTech - International Journal for Generation and Storage of Electricity and Heat. Issue 10 (2019). Technical Journal of the VGB PowerTech Association. Energy is us! Cyber security. Power generation. Environment. Flexibility.
VGB PowerTech - International Journal for Generation and Storage of Electricity and Heat. Issue 10 (2019).
Technical Journal of the VGB PowerTech Association. Energy is us!
Cyber security. Power generation. Environment. Flexibility.

Sie wollen auch ein ePaper? Erhöhen Sie die Reichweite Ihrer Titel.
YUMPU macht aus Druck-PDFs automatisch weboptimierte ePaper, die Google liebt.
<strong>VGB</strong> PowerTech <strong>10</strong> l <strong>2019</strong><br />
Flexible steam turbine operation in combined cycle power plants<br />
16<br />
16<br />
16<br />
12<br />
8<br />
4<br />
HP Inlet<br />
IP Inlet<br />
HP Outlet<br />
IP Outlet<br />
Outer Casing<br />
12<br />
8<br />
4<br />
HP Inlet<br />
IP Inlet<br />
HP Outlet<br />
IP Outlet<br />
Outer Casing<br />
12<br />
8<br />
4<br />
HP Inlet<br />
IP Inlet<br />
HP Outlet<br />
IP Outlet<br />
Outer Casing<br />
∆T in %<br />
0<br />
-4<br />
∆T in %<br />
0<br />
-4<br />
∆T in %<br />
0<br />
-4<br />
-8<br />
-8<br />
-8<br />
0 0.5 1 1.5 2<br />
<br />
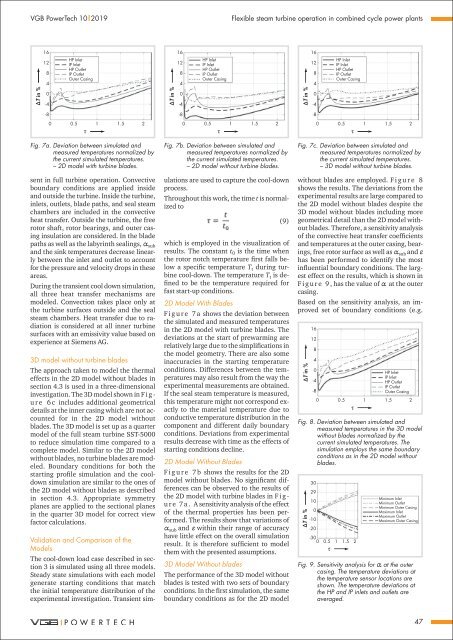
Fig. 7a. Deviation between simulated and<br />
measured temperatures normalized by<br />
the current simulated temperatures.<br />
– 2D model with turbine blades.<br />
sent in full turbine operation. Convective<br />
boundary conditions are applied inside<br />
and outside the turbine. Inside the turbine,<br />
inlets, outlets, blade paths, and seal steam<br />
chambers are included in the convective<br />
heat transfer. Outside the turbine, the free<br />
rotor shaft, rotor bearings, and outer casing<br />
insulation are considered. In the blade<br />
paths as well as the labyrinth sealings, sub<br />
and the sink temperatures decrease linearly<br />
between the inlet and outlet to account<br />
for the pressure and velocity drops in these<br />
areas.<br />
During the transient cool down simulation,<br />
all three heat transfer mechanisms are<br />
modeled. Convection takes place only at<br />
the turbine surfaces outside and the seal<br />
steam chambers. Heat transfer due to radiation<br />
is considered at all inner turbine<br />
surfaces with an emissivity value based on<br />
experience at Siemens AG.<br />
3D model without turbine blades<br />
The approach taken to model the thermal<br />
effects in the 2D model without blades in<br />
section 4.3 is used in a three-dimensional<br />
investigation. The 3D model shown in F i g -<br />
u r e 6 c includes additional geometrical<br />
details at the inner casing which are not accounted<br />
for in the 2D model without<br />
blades. The 3D model is set up as a quarter<br />
model of the full steam turbine SST-5000<br />
to reduce simulation time compared to a<br />
complete model. Similar to the 2D model<br />
without blades, no turbine blades are modeled.<br />
Boundary conditions for both the<br />
starting profile simulation and the cooldown<br />
simulation are similar to the ones of<br />
the 2D model without blades as described<br />
in section 4.3. Appropriate symmetry<br />
planes are applied to the sectional planes<br />
in the quarter 3D model for correct view<br />
factor calculations.<br />
0 0.5 1 1.5 2<br />
<br />
Fig. 7b. Deviation between simulated and<br />
measured temperatures normalized by<br />
the current simulated temperatures.<br />
– 2D model without turbine blades.<br />
Validation and Comparison of the<br />
Models<br />
The cool-down load case described in section<br />
3 is simulated using all three models.<br />
Steady state simulations with each model<br />
generate starting conditions that match<br />
the initial temperature distribution of the<br />
experimental investigation. Transient simulations<br />
are used to capture the cool-down<br />
process.<br />
Throughout this work, the time t is normalized<br />
to<br />
<br />
(9)<br />
which is employed in the visualization of<br />
results. The constant t 0 is the time when<br />
the rotor notch temperature first falls below<br />
a specific temperature T t during turbine<br />
cool-down. The temperature T t is defined<br />
to be the temperature required for<br />
fast start-up conditions.<br />
2D Model With Blades<br />
F i g u r e 7 a shows the deviation between<br />
the simulated and measured temperatures<br />
in the 2D model with turbine blades. The<br />
deviations at the start of prewarming are<br />
relatively large due to the simplifications in<br />
the model geometry. There are also some<br />
inaccuracies in the starting temperature<br />
conditions. Differences between the temperatures<br />
may also result from the way the<br />
experimental measurements are obtained.<br />
If the seal steam temperature is measured,<br />
this temperature might not correspond exactly<br />
to the material temperature due to<br />
conductive temperature distribution in the<br />
component and different daily boundary<br />
conditions. Deviations from experimental<br />
results decrease with time as the effects of<br />
starting conditions decline.<br />
2D Model Without Blades<br />
F i g u r e 7 b shows the results for the 2D<br />
model without blades. No significant differences<br />
can be observed to the results of<br />
the 2D model with turbine blades in F i g -<br />
u r e 7 a . A sensitivity analysis of the effect<br />
of the thermal properties has been performed.<br />
The results show that variations of<br />
sub and within their range of accuracy<br />
have little effect on the overall simulation<br />
result. It is therefore sufficient to model<br />
them with the presented assumptions.<br />
3D Model Without blades<br />
The performance of the 3D model without<br />
blades is tested with two sets of boundary<br />
conditions. In the first simulation, the same<br />
boundary conditions as for the 2D model<br />
0 0.5 1 1.5 2<br />
<br />
Fig. 7c. Deviation between simulated and<br />
measured temperatures normalized by<br />
the current simulated temperatures.<br />
– 3D model without turbine blades.<br />
without blades are employed. F i g u r e 8<br />
shows the results. The deviations from the<br />
experimental results are large compared to<br />
the 2D model without blades despite the<br />
3D model without blades including more<br />
geometrical detail than the 2D model without<br />
blades. Therefore, a sensitivity analysis<br />
of the convective heat transfer coefficients<br />
and temperatures at the outer casing, bearings,<br />
free rotor surface as well as sub and <br />
has been performed to identify the most<br />
influential boundary conditions. The largest<br />
effect on the results, which is shown in<br />
F i g u r e 9 , has the value of at the outer<br />
casing.<br />
Based on the sensitivity analysis, an improved<br />
set of boundary conditions (e.g.<br />
∆T in %<br />
16<br />
12<br />
8<br />
4<br />
0<br />
-4<br />
-8<br />
HP Inlet<br />
IP Inlet<br />
HP Outlet<br />
IP Outlet<br />
Outer Casing<br />
0 0.5 1 1.5 2<br />
<br />
Fig. 8. Deviation between simulated and<br />
measured temperatures in the 3D model<br />
without blades normalized by the<br />
current simulated temperatures. The<br />
simulation employs the same boundary<br />
conditions as in the 2D model without<br />
blades.<br />
∆T in %<br />
30<br />
29<br />
Minimum Inlet<br />
<strong>10</strong><br />
Minimum Outlet<br />
Minimum Outer Casing<br />
0<br />
Maximum Inlet<br />
Maximum Outlet<br />
-<strong>10</strong><br />
Maximum Outer Casing<br />
-20<br />
-30<br />
0 0.5 1 1.5 2<br />
<br />
Fig. 9. Sensitivity analysis for at the outer<br />
casing. The temperature deviations at<br />
the temperature sensor locations are<br />
shown. The temperature deviations at<br />
the HP and IP inlets and outlets are<br />
averaged.<br />
47