Scientism and Values.pdf - Ludwig von Mises Institute
Scientism and Values.pdf - Ludwig von Mises Institute
Scientism and Values.pdf - Ludwig von Mises Institute

You also want an ePaper? Increase the reach of your titles
YUMPU automatically turns print PDFs into web optimized ePapers that Google loves.
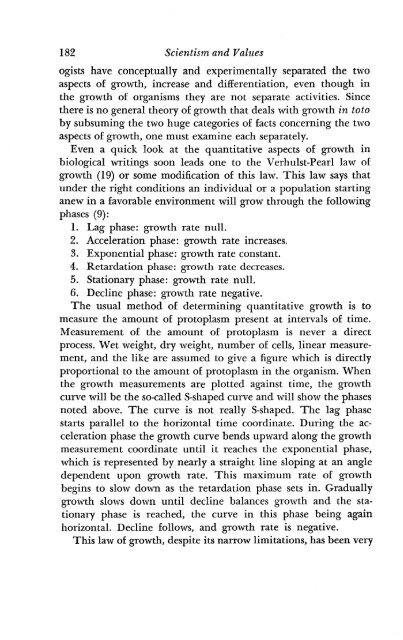
182 <strong>Scientism</strong> <strong>and</strong> <strong>Values</strong><br />
ogists have conceptually <strong>and</strong> experimentally separated the two<br />
aspects of growth, increase <strong>and</strong> differentiation, even though in<br />
the growth of organisms they are not separate activities. Since<br />
there is no general theory of growth that deals with growth in toto<br />
by subsuming the two huge categories of facts concerning the two<br />
aspects of growth, one must examine each separately.<br />
Even a quick look at the quantitative aspects of growth in<br />
biological writings soon leads one to the Verhulst-Pearl law of<br />
growth (19) or some modification of this law. This law says that<br />
under the right conditions an individual or a population starting<br />
anew in a favorable environment will grow through the following<br />
phases (9):<br />
1. Lag phase: growth rate null.<br />
2. Acceleration phase: growth rate increases.<br />
3. Exponential phase: growth rate constant.<br />
4. Retardation phase: growth rate decreases.<br />
5. Stationary phase: growth rate null.<br />
6. Decline phas,e: growth rate negative.<br />
The usual method of determining quantitative growth is to<br />
measure the amount of protoplasm present at intervals of time.<br />
Measurement of the amount of protoplasm is never a direct<br />
process. Wet weight, dry weight, number of cells, linear measurement,<br />
<strong>and</strong> the like are assumed to give a figure which is directly<br />
proportional to the amount of protoplasm in the organism. When<br />
the growth measurements are plotted against time, the growth<br />
curve will be the so-called S-shaped curve <strong>and</strong> will show the phases<br />
noted above. The curve is not really S-shaped. The lag phase<br />
starts parallel to the horizontal time coordinate. During the acceleration<br />
phase the growth curve bends upward along the growth<br />
measurement coordinate until it reaches the exponential phase,<br />
which is represented by nearly a straight line sloping at an angle<br />
dependent upon growth rate. This maximum rate of growth<br />
begins to slow down as the retardation phase sets in. Gradually<br />
growth slows down until decline balances growth <strong>and</strong> the stationary<br />
phase is reached, the curve in this phase being again<br />
horizontal. Decline follows, <strong>and</strong> growth rate is negative.<br />
This law of growth, despite its narrow limitations, has been very