Prva stran - WBC-INCO Net
Prva stran - WBC-INCO Net
Prva stran - WBC-INCO Net

Create successful ePaper yourself
Turn your PDF publications into a flip-book with our unique Google optimized e-Paper software.
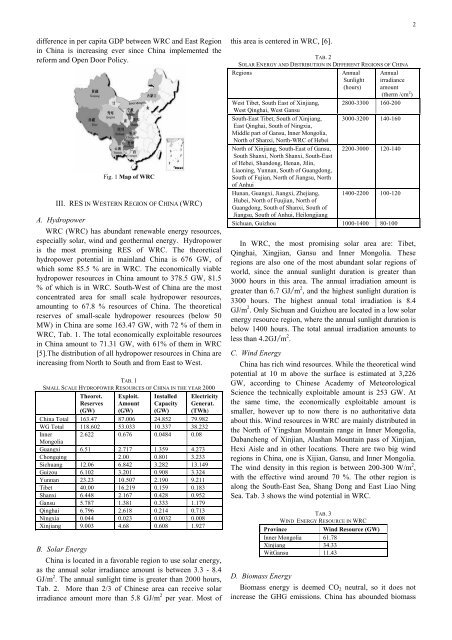
difference in per capita GDP between WRC and East Region<br />
in China is increasing ever since China implemented the<br />
reform and Open Door Policy.<br />
Fig. 1 Map of WRC<br />
III. RES IN WESTERN REGION OF CHINA (WRC)<br />
A. Hydropower<br />
WRC (WRC) has abundant renewable energy resources,<br />
especially solar, wind and geothermal energy. Hydropower<br />
is the most promising RES of WRC. The theoretical<br />
hydropower potential in mainland China is 676 GW, of<br />
which some 85.5 % are in WRC. The economically viable<br />
hydropower resources in China amount to 378.5 GW, 81.5<br />
% of which is in WRC. South-West of China are the most<br />
concentrated area for small scale hydropower resources,<br />
amounting to 67.8 % resources of China. The theoretical<br />
reserves of small-scale hydropower resources (below 50<br />
MW) in China are some 163.47 GW, with 72 % of them in<br />
WRC, Tab. 1. The total economically exploitable resources<br />
in China amount to 71.31 GW, with 61% of them in WRC<br />
[5].The distribution of all hydropower resources in China are<br />
increasing from North to South and from East to West.<br />
TAB. 1<br />
SMALL SCALE HYDROPOWER RESOURCES OF CHINA IN THE YEAR 2000<br />
Theoret.<br />
Reserves<br />
(GW)<br />
Exploit.<br />
Amount<br />
(GW)<br />
Installed<br />
Capacity<br />
(GW)<br />
Electricity<br />
Generat.<br />
(TWh)<br />
China Total 163.47 87.006 24.852 79.982<br />
WG Total 118.602 53.033 10.337 38.232<br />
Inner<br />
Mongolia<br />
2.622 0.676 0.0484 0.08<br />
Guangxi 6.51 2.717 1.359 4.273<br />
Chongqing 2.00 0.801 3.233<br />
Sichuang 12.06 6.842 3.282 13.149<br />
Guizou 6.102 3.201 0.908 3.324<br />
Yunnan 23.23 10.507 2.190 9.211<br />
Tibet 40.00 16.219 0.159 0.183<br />
Shanxi 6.448 2.167 0.428 0.952<br />
Gansu 5.787 1.381 0.333 1.179<br />
Qinghai 6.796 2.618 0.214 0.713<br />
Ningxia 0.044 0.023 0.0032 0.008<br />
Xinjiang 9.003 4.68 0.608 1.927<br />
B. Solar Energy<br />
China is located in a favorable region to use solar energy,<br />
as the annual solar irradiance amount is between 3.3 - 8.4<br />
GJ/m 2 . The annual sunlight time is greater than 2000 hours,<br />
Tab. 2. More than 2/3 of Chinese area can receive solar<br />
irradiance amount more than 5.8 GJ/m 2 per year. Most of<br />
this area is centered in WRC, [6].<br />
TAB. 2<br />
SOLAR ENERGY AND DISTRIBUTION IN DIFFERENT REGIONS OF CHINA<br />
Regions Annual<br />
Sunlight<br />
(hours)<br />
Annual<br />
irradiance<br />
amount<br />
(therm /cm 2 )<br />
West Tibet, South East of Xinjiang,<br />
West Qinghai, West Gansu<br />
2800-3300 160-200<br />
South-East Tibet, South of Xinjiang,<br />
East Qinghai, South of Ningxia,<br />
Middle part of Gansu, Inner Mongolia,<br />
North of Shanxi, North-WRC of Hebei<br />
3000-3200 140-160<br />
North of Xinjiang, South-East of Gansu,<br />
South Shanxi, North Shanxi, South-East<br />
of Hebei, Shandong, Henan, Jilin,<br />
Liaoning, Yunnan, South of Guangdong,<br />
South of Fujian, North of Jiangsu, North<br />
of Anhui<br />
2200-3000 120-140<br />
Hunan, Guangxi, Jiangxi, Zhejiang,<br />
Hubei, North of Fuujian, North of<br />
Guangdong, South of Shanxi, South of<br />
Jiangsu, South of Anhui, Heilongjiang<br />
1400-2200 100-120<br />
Sichuan, Guizhou 1000-1400 80-100<br />
In WRC, the most promising solar area are: Tibet,<br />
Qinghai, Xingjian, Gansu and Inner Mongolia. These<br />
regions are also one of the most abundant solar regions of<br />
world, since the annual sunlight duration is greater than<br />
3000 hours in this area. The annual irradiation amount is<br />
greater than 6.7 GJ/m 2 , and the highest sunlight duration is<br />
3300 hours. The highest annual total irradiation is 8.4<br />
GJ/m 2 . Only Sichuan and Guizhou are located in a low solar<br />
energy resource region, where the annual sunlight duration is<br />
below 1400 hours. The total annual irradiation amounts to<br />
less than 4.2GJ/m 2 .<br />
C. Wind Energy<br />
China has rich wind resources. While the theoretical wind<br />
potential at 10 m above the surface is estimated at 3,226<br />
GW, according to Chinese Academy of Meteorological<br />
Science the technically exploitable amount is 253 GW. At<br />
the same time, the economically exploitable amount is<br />
smaller, however up to now there is no authoritative data<br />
about this. Wind resources in WRC are mainly distributed in<br />
the North of Yingshan Mountain range in Inner Mongolia,<br />
Dabancheng of Xinjian, Alashan Mountain pass of Xinjian,<br />
Hexi Aisle and in other locations. There are two big wind<br />
regions in China, one is Xijian, Gansu, and Inner Mongolia.<br />
The wind density in this region is between 200-300 W/m 2 ,<br />
with the effective wind around 70 %. The other region is<br />
along the South-East Sea, Shang Dong and East Liao Ning<br />
Sea. Tab. 3 shows the wind potential in WRC.<br />
TAB. 3<br />
WIND ENERGY RESOURCE IN WRC<br />
Province Wind Resource (GW)<br />
Inner Mongolia 61.78<br />
Xinjiang 34.33<br />
WitGansu 11.43<br />
D. Biomass Energy<br />
Biomass energy is deemed CO2 neutral, so it does not<br />
increase the GHG emissions. China has abounded biomass<br />
2