Prva stran - WBC-INCO Net
Prva stran - WBC-INCO Net
Prva stran - WBC-INCO Net

You also want an ePaper? Increase the reach of your titles
YUMPU automatically turns print PDFs into web optimized ePapers that Google loves.
exploited.<br />
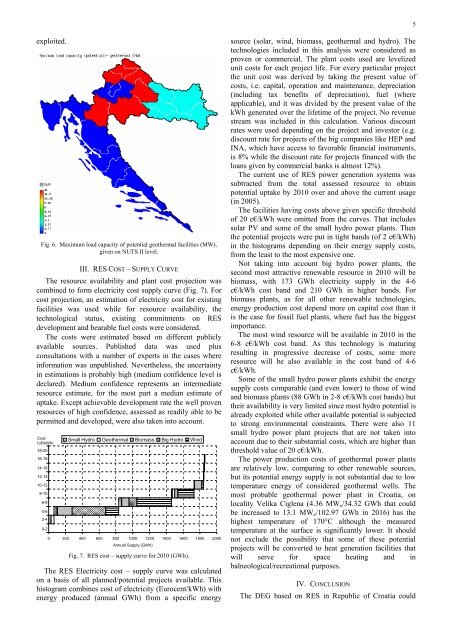
Fig. 6. Maximum load capacity of potential geothermal facilities (MW),<br />
given on NUTS II level.<br />
III. RES COST – SUPPLY CURVE<br />
The resource availability and plant cost projection was<br />
combined to form electricity cost supply curve (Fig. 7). For<br />
cost projection, an estimation of electricity cost for existing<br />
facilities was used while for resource availability, the<br />
technological status, existing commitments on RES<br />
development and bearable fuel costs were considered.<br />
The costs were estimated based on different publicly<br />
available sources. Published data was used plus<br />
consultations with a number of experts in the cases where<br />
information was unpublished. Nevertheless, the uncertainty<br />
in estimations is probably high (medium confidence level is<br />
declared). Medium confidence represents an intermediate<br />
resource estimate, for the most part a median estimate of<br />
uptake. Except achievable development rate the well proven<br />
resources of high confidence, assessed as readily able to be<br />
permitted and developed, were also taken into account.<br />
Cost<br />
(c€/kWh)<br />
18-20<br />
16-18<br />
14-16<br />
12-14<br />
10-12<br />
8-10<br />
6-8<br />
4-6<br />
2-4<br />
0-2<br />
Small Hydro Geothermal Biomass Big Hydro Wind<br />
0 200 400 600 800 1000 1200 1400 1600 1800 2000<br />
Annual Supply (GWh)<br />
Fig. 7. RES cost – supply curve for 2010 (GWh).<br />
The RES Electricity cost – supply curve was calculated<br />
on a basis of all planned/potential projects available. This<br />
histogram combines cost of electricity (Eurocent/kWh) with<br />
energy produced (annual GWh) from a specific energy<br />
source (solar, wind, biomass, geothermal and hydro). The<br />
technologies included in this analysis were considered as<br />
proven or commercial. The plant costs used are levelized<br />
unit costs for each project life. For every particular project<br />
the unit cost was derived by taking the present value of<br />
costs, i.e. capital, operation and maintenance, depreciation<br />
(including tax benefits of depreciation), fuel (where<br />
applicable), and it was divided by the present value of the<br />
kWh generated over the lifetime of the project. No revenue<br />
stream was included in this calculation. Various discount<br />
rates were used depending on the project and investor (e.g.<br />
discount rate for projects of the big companies like HEP and<br />
INA, which have access to favorable financial instruments,<br />
is 8% while the discount rate for projects financed with the<br />
loans given by commercial banks is almost 12%).<br />
The current use of RES power generation systems was<br />
subtracted from the total assessed resource to obtain<br />
potential uptake by 2010 over and above the current usage<br />
(in 2005).<br />
The facilities having costs above given specific threshold<br />
of 20 c€/kWh were omitted from the curves. That includes<br />
solar PV and some of the small hydro power plants. Then<br />
the potential projects were put in tight bands (of 2 c€/kWh)<br />
in the histograms depending on their energy supply costs,<br />
from the least to the most expensive one.<br />
Not taking into account big hydro power plants, the<br />
second most attractive renewable resource in 2010 will be<br />
biomass, with 173 GWh electricity supply in the 4-6<br />
c€/kWh cost band and 210 GWh in higher bands. For<br />
biomass plants, as for all other renewable technologies,<br />
energy production cost depend more on capital cost than it<br />
is the case for fossil fuel plants, where fuel has the biggest<br />
importance.<br />
The most wind resource will be available in 2010 in the<br />
6-8 c€/kWh cost band. As this technology is maturing<br />
resulting in progressive decrease of costs, some more<br />
resource will be also available in the cost band of 4-6<br />
c€/kWh.<br />
Some of the small hydro power plants exhibit the energy<br />
supply costs comparable (and even lower) to those of wind<br />
and biomass plants (88 GWh in 2-8 c€/kWh cost bands) but<br />
their availability is very limited since most hydro potential is<br />
already exploited while other available potential is subjected<br />
to strong environmental constraints. There were also 11<br />
small hydro power plant projects that are not taken into<br />
account due to their substantial costs, which are higher than<br />
threshold value of 20 c€/kWh.<br />
The power production costs of geothermal power plants<br />
are relatively low, comparing to other renewable sources,<br />
but its potential energy supply is not substantial due to low<br />
temperature energy of considered geothermal wells. The<br />
most probable geothermal power plant in Croatia, on<br />
locality Velika Ciglena (4.36 MWe/34.32 GWh that could<br />
be increased to 13.1 MWe/102.97 GWh in 2016) has the<br />
highest temperature of 170°C although the measured<br />
temperature at the surface is significantly lower. It should<br />
not exclude the possibility that some of these potential<br />
projects will be converted to heat generation facilities that<br />
will serve for space heating and in<br />
balneological/recreational purposes.<br />
IV. CONCLUSION<br />
The DEG based on RES in Republic of Croatia could<br />
5