Housing Counseling Process Evaluation and Design of ... - HUD User
Housing Counseling Process Evaluation and Design of ... - HUD User
Housing Counseling Process Evaluation and Design of ... - HUD User

You also want an ePaper? Increase the reach of your titles
YUMPU automatically turns print PDFs into web optimized ePapers that Google loves.
Characteristics <strong>of</strong> <strong>Counseling</strong> Clients<br />
Race <strong>and</strong> Ethnicity<br />
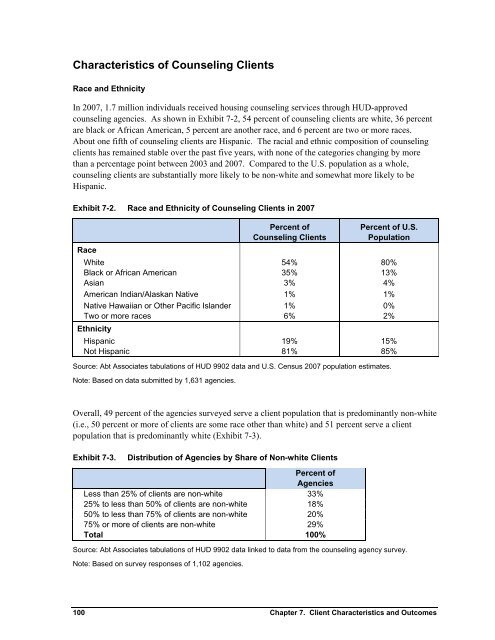
In 2007, 1.7 million individuals received housing counseling services through <strong>HUD</strong>-approved<br />
counseling agencies. As shown in Exhibit 7-2, 54 percent <strong>of</strong> counseling clients are white, 36 percent<br />
are black or African American, 5 percent are another race, <strong>and</strong> 6 percent are two or more races.<br />
About one fifth <strong>of</strong> counseling clients are Hispanic. The racial <strong>and</strong> ethnic composition <strong>of</strong> counseling<br />
clients has remained stable over the past five years, with none <strong>of</strong> the categories changing by more<br />
than a percentage point between 2003 <strong>and</strong> 2007. Compared to the U.S. population as a whole,<br />
counseling clients are substantially more likely to be non-white <strong>and</strong> somewhat more likely to be<br />
Hispanic.<br />
Exhibit 7-2. Race <strong>and</strong> Ethnicity <strong>of</strong> <strong>Counseling</strong> Clients in 2007<br />
Percent <strong>of</strong><br />
Percent <strong>of</strong> U.S.<br />
<strong>Counseling</strong> Clients<br />
Population<br />
Race<br />
White 54% 80%<br />
Black or African American 35% 13%<br />
Asian 3% 4%<br />
American Indian/Alaskan Native 1% 1%<br />
Native Hawaiian or Other Pacific Isl<strong>and</strong>er 1% 0%<br />
Two or more races 6% 2%<br />
Ethnicity<br />
Hispanic 19% 15%<br />
Not Hispanic 81% 85%<br />
Source: Abt Associates tabulations <strong>of</strong> <strong>HUD</strong> 9902 data <strong>and</strong> U.S. Census 2007 population estimates.<br />
Note: Based on data submitted by 1,631 agencies.<br />
Overall, 49 percent <strong>of</strong> the agencies surveyed serve a client population that is predominantly non-white<br />
(i.e., 50 percent or more <strong>of</strong> clients are some race other than white) <strong>and</strong> 51 percent serve a client<br />
population that is predominantly white (Exhibit 7-3).<br />
Exhibit 7-3.<br />
Distribution <strong>of</strong> Agencies by Share <strong>of</strong> Non-white Clients<br />
Less than 25% <strong>of</strong> clients are non-white<br />
25% to less than 50% <strong>of</strong> clients are non-white<br />
50% to less than 75% <strong>of</strong> clients are non-white<br />
75% or more <strong>of</strong> clients are non-white<br />
Total<br />
Percent <strong>of</strong><br />
Agencies<br />
33%<br />
18%<br />
20%<br />
29%<br />
100%<br />
Source: Abt Associates tabulations <strong>of</strong> <strong>HUD</strong> 9902 data linked to data from the counseling agency survey.<br />
Note: Based on survey responses <strong>of</strong> 1,102 agencies.<br />
100<br />
Chapter 7. Client Characteristics <strong>and</strong> Outcomes