(MERAF) for the Base Metals Smelting Sector - CCME
(MERAF) for the Base Metals Smelting Sector - CCME
(MERAF) for the Base Metals Smelting Sector - CCME

Create successful ePaper yourself
Turn your PDF publications into a flip-book with our unique Google optimized e-Paper software.
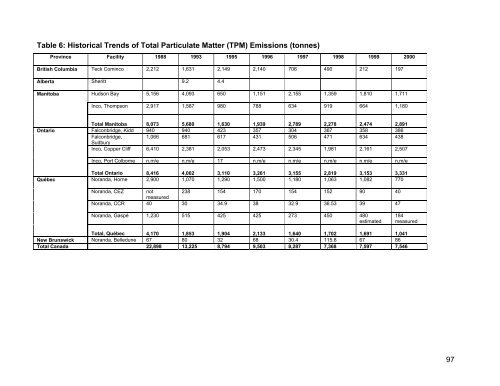
Table 6: Historical Trends of Total Particulate Matter (TPM) Emissions (tonnes)<br />
Province Facility 1988 1993 1995 1996 1997 1998 1999 2000<br />
British Columbia Teck Cominco 2,212 1,631 2,149 2,140 706 490 212 197<br />
Alberta Sheritt 9.2 4.4<br />
Manitoba Hudson Bay 5,156 4,093 650 1,151 2,155 1,359 1,810 1,711<br />
Inco, Thompson 2,917 1,587 980 788 634 919 664 1,180<br />
Total Manitoba 8,073 5,680 1,630 1,939 2,789 2,278 2,474 2,891<br />
Ontario Falconbridge, Kidd 940 940 423 357 304 367 358 386<br />
Falconbridge, 1,066 681 617 431 506 471 634 438<br />
Sudbury<br />
Inco, Copper Cliff 6,410 2,381 2,053 2,473 2,345 1,981 2,161 2,507<br />
Inco, Port Colborne n.m/e n.m/e 17 n.m/e n.m/e n.m/e n.m/e n.m/e<br />
Total Ontario 8,416 4,002 3,110 3,261 3,155 2,819 3,153 3,331<br />
Québec Noranda, Horne 2,900 1,070 1,290 1,500 1,180 1,063 1,082 770<br />
Noranda, CEZ not<br />
238 154 170 154 152 90 40<br />
measured<br />
Noranda, CCR 40 30 34.9 38 32.9 36.53 39 47<br />
Noranda, Gaspé 1,230 515 425 425 273 450 480<br />
estimated<br />
184<br />
measured<br />
Total, Québec 4,170 1,853 1,904 2,133 1,640 1,702 1,691 1,041<br />
New Brunswick Noranda, Belledune 67 80 32 68 30.4 115.8 67 86<br />
Total Canada 22,898 13,225 8,794 9,503 8,287 7,368 7,597 7,546<br />
97