Table 7: Historical Trends of Sulphur Dioxide (SO 2 ) Emissions (tonnes) Province Facility 1988 1993 1995 1996 1997 1998 1999 2000 British Columbia Teck Cominco 20,075 14,235 15,111 13,578 4,453 3,041 3,066 3,117 Alberta Sheritt Manitoba Hudson Bay 265,804 268,366 162 ,104 183,280 178,924 185,200 185,559 137,608 Inco, Thompson 283,200 253,000 196,000 195,000 210,000 217,000 139,362 214,502 Total Manitoba 549,004 521,366 358,104 378,280 388,924 402,200 324,921 352,110 Ontario Falconbridge, Kidd 5,980 5,947 6,180 6,510 5,240 4,090 5,110 3,820 Falconbridge, 59,600 57,300 45,200 53,200 53,600 57,200 35,800 27,654 Sudbury Inco, Copper Cliff 658,515 357,751 236,033 236,041 200,003 235,000 220,987 222,906 Inco, Port Colborne not significant not significant not significant not significant not significant not significant not significant not significant Total Ontario 724,095 420,998 287,413 295,751 258,843 296,290 261,897 254,380 Québec Noranda, Horne 420,000 168,000 172,000 148,000 144,000 112,556 94,000 90,000 Noranda, CEZ 5,000 3,860 3,311 3,900 4,100 3,923 5,025 6,143 Noranda, CCR 340 247 190 246 451 313 338 368 (MAC Report) Noranda, Gaspé 57,498 42,906 43,188 38,594 33,958 31,448 34,222 43,192 Total, Québec 482,838 215,013 218,689 190,740 182,509 148,240 133,585 139,703 New Brunswick Noranda, Belledune 21,204 5,694 12,056 11,467 12,010 12,770 12,220 11,938 Total Canada 1,797,216 1,177,306 891,373 889,816 846,739 862,541 735,689 761,248 98
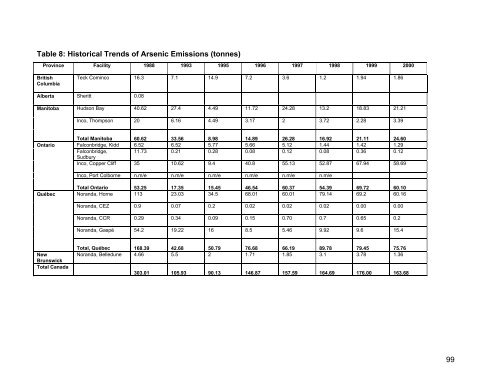
Table 8: Historical Trends of Arsenic Emissions (tonnes) Province Facility 1988 1993 1995 1996 1997 1998 1999 2000 British Columbia Teck Cominco 16.3 7.1 14.9 7.2 3.6 1.2 1.94 1.86 Alberta Sheritt 0.08 Manitoba Hudson Bay 40.62 27.4 4.49 11.72 24.28 13.2 18.83 21.21 Inco, Thompson 20 6.16 4.49 3.17 2 3.72 2.28 3.39 Total Manitoba 60.62 33.56 8.98 14.89 26.28 16.92 21.11 24.60 Ontario Falconbridge, Kidd 6.52 6.52 5.77 5.66 5.12 1.44 1.42 1.29 Falconbridge, 11.73 0.21 0.28 0.08 0.12 0.08 0.36 0.12 Sudbury Inco, Copper Cliff 35 10.62 9.4 40.8 55.13 52.87 67.94 58.69 Inco, Port Colborne n.m/e n.m/e n.m/e n.m/e n.m/e n.m/e Total Ontario 53.25 17.35 15.45 46.54 60.37 54.39 69.72 60.10 Québec Noranda, Horne 113 23.03 34.5 68.01 60.01 79.14 69.2 60.16 Noranda, CEZ 0.9 0.07 0.2 0.02 0.02 0.02 0.00 0.00 Noranda, CCR 0.29 0.34 0.09 0.15 0.70 0.7 0.65 0.2 Noranda, Gaspé 54.2 19.22 16 8.5 5.46 9.92 9.6 15.4 New Brunswick Total Canada Total, Québec 168.39 42.68 50.79 76.68 66.19 89.78 79.45 75.76 Noranda, Belledune 4.66 5.5 2 1.71 1.85 3.1 3.78 1.36 303.01 105.93 90.13 146.87 157.59 164.69 176.00 163.68 99
- Page 1 and 2:
FINAL REPORT Multi-pollutant Emissi
- Page 3 and 4:
Acknowledgments The principal autho
- Page 5 and 6:
Summary The purpose of the report i
- Page 7 and 8:
• Recommendations to address info
- Page 9 and 10:
• The Minerals and Metals Foundat
- Page 11 and 12:
The next series of tables illustrat
- Page 13 and 14:
1,800.00 1,600.00 1,400.00 1,200.00
- Page 15 and 16:
S.4 Current emission management pra
- Page 17 and 18:
− The EPA has started developing
- Page 19 and 20:
T.1 Technical Options for Emission
- Page 21 and 22:
T.3 Technical Options for Emission
- Page 23 and 24:
T.5 Technical Options for Emission
- Page 25 and 26:
The predicted future releases and t
- Page 27 and 28:
Noranda Gaspé Rest of Sector** Sit
- Page 29 and 30:
Recommendation #3 It is also recomm
- Page 31 and 32:
2.4.8. Leaching ...................
- Page 33 and 34:
4.1.11.6. Mercury..................
- Page 35 and 36:
Figure 35: 2000 Nickel - Air Emissi
- Page 37 and 38:
Table 34: World Bank Guidelines for
- Page 39 and 40:
1. Introduction The purpose of the
- Page 41 and 42:
strong surrogate for fine particles
- Page 43 and 44:
• These sectors are common to mos
- Page 45 and 46:
(a) have or may have an immediate o
- Page 47 and 48:
2. INDUSTRY PROFILE 2.1. Sector Def
- Page 49 and 50:
2.3. Base Metals Smelting Processes
- Page 51 and 52:
2.3.1. Pretreatment Pretreatment of
- Page 53 and 54:
Metallic impurities either dissolve
- Page 55 and 56:
2.4. Environmental Concerns 29 The
- Page 57 and 58:
sulphur dioxide in the off-gases th
- Page 59 and 60:
2.5. Canadian Base Metals Smelters
- Page 61 and 62:
ammonium sulphate fertilizers. The
- Page 63 and 64:
The copper smelter uses pyrometallu
- Page 65 and 66:
copper, zinc, cadmium and indium, a
- Page 67 and 68:
2.6.6.2. Noranda Inc., Division CEZ
- Page 69 and 70:
2.7. Key Industrial Associations Ex
- Page 71 and 72:
In terms of tonnage, zinc ranks fir
- Page 73 and 74:
Table 4: Canadian Base Metals Expor
- Page 75 and 76:
ased 62 pricing system. In response
- Page 77 and 78:
The LME has a multi-tiered membersh
- Page 79 and 80:
The BMSS IT held ten meetings betwe
- Page 81 and 82:
3.1.1.2. Smelters Emissions Testing
- Page 83 and 84:
achieve their commitments, are publ
- Page 85 and 86: All the companies mentioned in this
- Page 87 and 88: emoved for processing in the Copper
- Page 89 and 90: Lead Concentrate Zinc Residue Lead
- Page 91 and 92: 3.2.2. Sherritt International Corpo
- Page 93 and 94: 3.2.2.5. Cobalt conversion and redu
- Page 95 and 96: Figure 4: Sherritt Metals Refinery
- Page 97 and 98: The blister copper is then treated
- Page 99 and 100: Figure 6: Hudson Bay Mining and Sme
- Page 101 and 102: Figure 7: Inco Thompson Nickel Smel
- Page 103 and 104: 3.2.5. Falconbridge Limited, Kidd M
- Page 105 and 106: electrostatic precipitator dust fro
- Page 107 and 108: Figure 10: Falconbridge Kidd Copper
- Page 109 and 110: 3.2.6. Falconbridge, Sudbury Divisi
- Page 111 and 112: Figure 12: Falconbridge Sudbury Nic
- Page 113 and 114: from the fluid bed roasters are tre
- Page 115 and 116: Figure 14: Inco Copper Cliff Nickel
- Page 117 and 118: 3.2.8. Inco Port Colborne 87 Figure
- Page 119 and 120: 3.2.9. Noranda Inc., Horne Smelter,
- Page 121 and 122: Figure 17: Noranda Horne Copper Sme
- Page 123 and 124: Figure 18: Noranda CEZ Zinc Plant T
- Page 125 and 126: Fugitive emissions from the TBRC op
- Page 127 and 128: 3.2.12. Noranda Inc., Division Mine
- Page 129 and 130: Figure 20: Noranda Gaspé Copper Sm
- Page 131 and 132: with water to preserve the environm
- Page 133 and 134: 3.3. Analysis of Emissions 3.3.1. T
- Page 135: Table 6: Historical Trends of Total
- Page 139 and 140: Table 10: Historical Trends of Lead
- Page 141 and 142: Table 12: Historical Trends of Nick
- Page 143 and 144: 350 300 250 200 150 100 Total Secto
- Page 145 and 146: 1,400.00 1,200.00 1,000.00 800.00 6
- Page 147 and 148: Table 13: Releases of Dioxins and F
- Page 149 and 150: 3.4. Other Current Emissions Inform
- Page 151 and 152: Sulphur Dioxide - Air EPI 4500 4000
- Page 153 and 154: Cadium - Air EPI 0.2 0.15 0.1 0.05
- Page 155 and 156: Mercury- Air EPI 9 8 7 6 5 4 3 2 1
- Page 157 and 158: 4. CURRENT EMISSION MANAGEMENT PRAC
- Page 159 and 160: The “Alberta Ambient Air Quality
- Page 161 and 162: 4.1.9. New Brunswick New Brunswick
- Page 163 and 164: 4.1.11.1. Particulate Matter Table
- Page 165 and 166: Table 15: Canadian Ambient Particul
- Page 167 and 168: Sulphur Dioxide Releases from Coppe
- Page 169 and 170: 4.1.11.3. Arsenic Table 18 shows th
- Page 171 and 172: 4.1.11.5. Lead Table 22 shows the C
- Page 173 and 174: 4.1.11.6. Mercury Table 24 shows th
- Page 175 and 176: 4.1.11.7. Nickel Table 26 shows the
- Page 177 and 178: New Source Performance Standards (N
- Page 179 and 180: Table 31: US National Emission Stan
- Page 181 and 182: In the permitting process, faciliti
- Page 183 and 184: Table 34: World Bank Guidelines for
- Page 185 and 186: 4.2.4. Australia Air quality is con
- Page 187 and 188:
Table 39: Australia/New South Wales
- Page 189 and 190:
4.2.5. Japan Environmental quality
- Page 191 and 192:
Sulphur dioxide, particulate matter
- Page 193 and 194:
Table 47: Germany Particulate Matte
- Page 195 and 196:
Table 51: The Netherlands Sulphur D
- Page 197 and 198:
Table 53: France Particulate Matter
- Page 199 and 200:
The Environment Protection (Prescri
- Page 201 and 202:
Table 60: United Kingdom Releases t
- Page 203 and 204:
4.2.12. Other European Countries Ta
- Page 205 and 206:
4.3. Best Available Techniques for
- Page 207 and 208:
4.4. Options and Preliminary Cost E
- Page 209 and 210:
plant. It would be possible to inst
- Page 211 and 212:
4.4.2. Inco Limited, Thompson Divis
- Page 213 and 214:
4.4.3. Falconbridge, Sudbury Divisi
- Page 215 and 216:
4.4.4. Inco Limited, Sudbury/Copper
- Page 217 and 218:
4.4.5. Noranda Inc., Horne Smelter,
- Page 219 and 220:
4.4.6. Noranda Inc., Division Mines
- Page 221 and 222:
Table 78: Technical Options for Emi
- Page 223 and 224:
Site Option for Reduction By 2008 O
- Page 225 and 226:
Site Option for Reduction By 2008 O
- Page 227 and 228:
Noranda Horne Site Option for Reduc
- Page 229 and 230:
5. CONCLUSIONS AND RECOMMENDATIONS
- Page 231 and 232:
Appendix A: Health and Environmenta
- Page 233 and 234:
List of Acronyms AAQ AAQC ARET BACT
- Page 235 and 236:
UN/ECE URL USEPA VCR VOC United Nat
- Page 237 and 238:
at the anode and selectively plates
- Page 239:
Sinter: Slag: Slag cleaning: Top Bl