- Page 1 and 2:
FINAL REPORT Multi-pollutant Emissi
- Page 3 and 4:
Acknowledgments The principal autho
- Page 5 and 6:
Summary The purpose of the report i
- Page 7 and 8:
• Recommendations to address info
- Page 9 and 10:
• The Minerals and Metals Foundat
- Page 11 and 12:
The next series of tables illustrat
- Page 13 and 14:
1,800.00 1,600.00 1,400.00 1,200.00
- Page 15 and 16:
S.4 Current emission management pra
- Page 17 and 18:
− The EPA has started developing
- Page 19 and 20:
T.1 Technical Options for Emission
- Page 21 and 22:
T.3 Technical Options for Emission
- Page 23 and 24:
T.5 Technical Options for Emission
- Page 25 and 26:
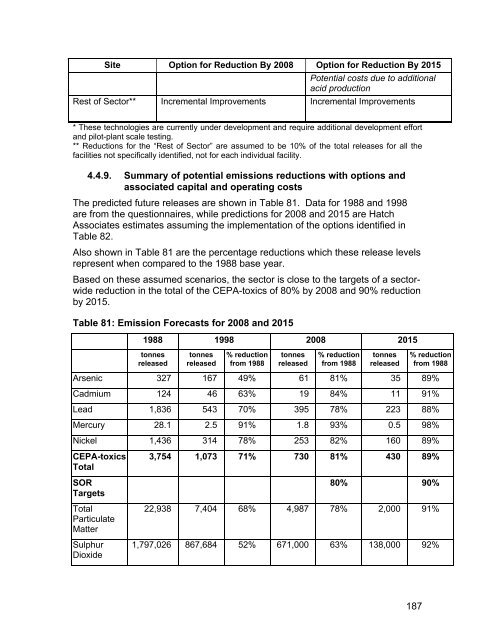
The predicted future releases and t
- Page 27 and 28:
Noranda Gaspé Rest of Sector** Sit
- Page 29 and 30:
Recommendation #3 It is also recomm
- Page 31 and 32:
2.4.8. Leaching ...................
- Page 33 and 34:
4.1.11.6. Mercury..................
- Page 35 and 36:
Figure 35: 2000 Nickel - Air Emissi
- Page 37 and 38:
Table 34: World Bank Guidelines for
- Page 39 and 40:
1. Introduction The purpose of the
- Page 41 and 42:
strong surrogate for fine particles
- Page 43 and 44:
• These sectors are common to mos
- Page 45 and 46:
(a) have or may have an immediate o
- Page 47 and 48:
2. INDUSTRY PROFILE 2.1. Sector Def
- Page 49 and 50:
2.3. Base Metals Smelting Processes
- Page 51 and 52:
2.3.1. Pretreatment Pretreatment of
- Page 53 and 54:
Metallic impurities either dissolve
- Page 55 and 56:
2.4. Environmental Concerns 29 The
- Page 57 and 58:
sulphur dioxide in the off-gases th
- Page 59 and 60:
2.5. Canadian Base Metals Smelters
- Page 61 and 62:
ammonium sulphate fertilizers. The
- Page 63 and 64:
The copper smelter uses pyrometallu
- Page 65 and 66:
copper, zinc, cadmium and indium, a
- Page 67 and 68:
2.6.6.2. Noranda Inc., Division CEZ
- Page 69 and 70:
2.7. Key Industrial Associations Ex
- Page 71 and 72:
In terms of tonnage, zinc ranks fir
- Page 73 and 74:
Table 4: Canadian Base Metals Expor
- Page 75 and 76:
ased 62 pricing system. In response
- Page 77 and 78:
The LME has a multi-tiered membersh
- Page 79 and 80:
The BMSS IT held ten meetings betwe
- Page 81 and 82:
3.1.1.2. Smelters Emissions Testing
- Page 83 and 84:
achieve their commitments, are publ
- Page 85 and 86:
All the companies mentioned in this
- Page 87 and 88:
emoved for processing in the Copper
- Page 89 and 90:
Lead Concentrate Zinc Residue Lead
- Page 91 and 92:
3.2.2. Sherritt International Corpo
- Page 93 and 94:
3.2.2.5. Cobalt conversion and redu
- Page 95 and 96:
Figure 4: Sherritt Metals Refinery
- Page 97 and 98:
The blister copper is then treated
- Page 99 and 100:
Figure 6: Hudson Bay Mining and Sme
- Page 101 and 102:
Figure 7: Inco Thompson Nickel Smel
- Page 103 and 104:
3.2.5. Falconbridge Limited, Kidd M
- Page 105 and 106:
electrostatic precipitator dust fro
- Page 107 and 108:
Figure 10: Falconbridge Kidd Copper
- Page 109 and 110:
3.2.6. Falconbridge, Sudbury Divisi
- Page 111 and 112:
Figure 12: Falconbridge Sudbury Nic
- Page 113 and 114:
from the fluid bed roasters are tre
- Page 115 and 116:
Figure 14: Inco Copper Cliff Nickel
- Page 117 and 118:
3.2.8. Inco Port Colborne 87 Figure
- Page 119 and 120:
3.2.9. Noranda Inc., Horne Smelter,
- Page 121 and 122:
Figure 17: Noranda Horne Copper Sme
- Page 123 and 124:
Figure 18: Noranda CEZ Zinc Plant T
- Page 125 and 126:
Fugitive emissions from the TBRC op
- Page 127 and 128:
3.2.12. Noranda Inc., Division Mine
- Page 129 and 130:
Figure 20: Noranda Gaspé Copper Sm
- Page 131 and 132:
with water to preserve the environm
- Page 133 and 134:
3.3. Analysis of Emissions 3.3.1. T
- Page 135 and 136:
Table 6: Historical Trends of Total
- Page 137 and 138:
Table 8: Historical Trends of Arsen
- Page 139 and 140:
Table 10: Historical Trends of Lead
- Page 141 and 142:
Table 12: Historical Trends of Nick
- Page 143 and 144:
350 300 250 200 150 100 Total Secto
- Page 145 and 146:
1,400.00 1,200.00 1,000.00 800.00 6
- Page 147 and 148:
Table 13: Releases of Dioxins and F
- Page 149 and 150:
3.4. Other Current Emissions Inform
- Page 151 and 152:
Sulphur Dioxide - Air EPI 4500 4000
- Page 153 and 154:
Cadium - Air EPI 0.2 0.15 0.1 0.05
- Page 155 and 156:
Mercury- Air EPI 9 8 7 6 5 4 3 2 1
- Page 157 and 158:
4. CURRENT EMISSION MANAGEMENT PRAC
- Page 159 and 160:
The “Alberta Ambient Air Quality
- Page 161 and 162:
4.1.9. New Brunswick New Brunswick
- Page 163 and 164:
4.1.11.1. Particulate Matter Table
- Page 165 and 166:
Table 15: Canadian Ambient Particul
- Page 167 and 168:
Sulphur Dioxide Releases from Coppe
- Page 169 and 170:
4.1.11.3. Arsenic Table 18 shows th
- Page 171 and 172:
4.1.11.5. Lead Table 22 shows the C
- Page 173 and 174: 4.1.11.6. Mercury Table 24 shows th
- Page 175 and 176: 4.1.11.7. Nickel Table 26 shows the
- Page 177 and 178: New Source Performance Standards (N
- Page 179 and 180: Table 31: US National Emission Stan
- Page 181 and 182: In the permitting process, faciliti
- Page 183 and 184: Table 34: World Bank Guidelines for
- Page 185 and 186: 4.2.4. Australia Air quality is con
- Page 187 and 188: Table 39: Australia/New South Wales
- Page 189 and 190: 4.2.5. Japan Environmental quality
- Page 191 and 192: Sulphur dioxide, particulate matter
- Page 193 and 194: Table 47: Germany Particulate Matte
- Page 195 and 196: Table 51: The Netherlands Sulphur D
- Page 197 and 198: Table 53: France Particulate Matter
- Page 199 and 200: The Environment Protection (Prescri
- Page 201 and 202: Table 60: United Kingdom Releases t
- Page 203 and 204: 4.2.12. Other European Countries Ta
- Page 205 and 206: 4.3. Best Available Techniques for
- Page 207 and 208: 4.4. Options and Preliminary Cost E
- Page 209 and 210: plant. It would be possible to inst
- Page 211 and 212: 4.4.2. Inco Limited, Thompson Divis
- Page 213 and 214: 4.4.3. Falconbridge, Sudbury Divisi
- Page 215 and 216: 4.4.4. Inco Limited, Sudbury/Copper
- Page 217 and 218: 4.4.5. Noranda Inc., Horne Smelter,
- Page 219 and 220: 4.4.6. Noranda Inc., Division Mines
- Page 221 and 222: Table 78: Technical Options for Emi
- Page 223: Site Option for Reduction By 2008 O
- Page 227 and 228: Noranda Horne Site Option for Reduc
- Page 229 and 230: 5. CONCLUSIONS AND RECOMMENDATIONS
- Page 231 and 232: Appendix A: Health and Environmenta
- Page 233 and 234: List of Acronyms AAQ AAQC ARET BACT
- Page 235 and 236: UN/ECE URL USEPA VCR VOC United Nat
- Page 237 and 238: at the anode and selectively plates
- Page 239: Sinter: Slag: Slag cleaning: Top Bl


