1 - Instituto de Biologia da UFRJ
1 - Instituto de Biologia da UFRJ
1 - Instituto de Biologia da UFRJ

Create successful ePaper yourself
Turn your PDF publications into a flip-book with our unique Google optimized e-Paper software.
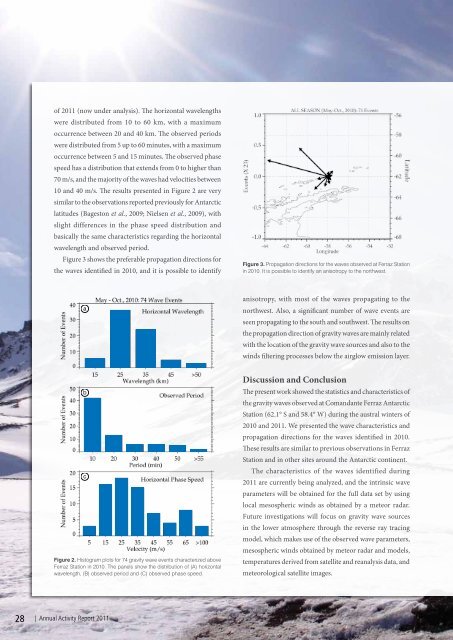
of 2011 (now un<strong>de</strong>r analysis). The horizontal wavelengths<br />
were distributed from 10 to 60 km, with a maximum<br />
occurrence between 20 and 40 km. The observed periods<br />
were distributed from 5 up to 60 minutes, with a maximum<br />
occurrence between 5 and 15 minutes. The observed phase<br />
speed has a distribution that extends from 0 to higher than<br />
70 m/s, and the majority of the waves had velocities between<br />
10 and 40 m/s. The results presented in Figure 2 are very<br />
similar to the observations reported previously for Antarctic<br />
latitu<strong>de</strong>s (Bageston et al., 2009; Nielsen et al., 2009), with<br />
slight differences in the phase speed distribution and<br />
basically the same characteristics regarding the horizontal<br />
wavelength and observed period.<br />
Figure 3 shows the preferable propagation directions for<br />
the waves i<strong>de</strong>ntified in 2010, and it is possible to i<strong>de</strong>ntify<br />
Figure 3. Propagation directions for the waves observed at Ferraz Station<br />
in 2010. It is possible to i<strong>de</strong>ntify an anisotropy to the northwest.<br />
a<br />
anisotropy, with most of the waves propagating to the<br />
northwest. Also, a significant number of wave events are<br />
seen propagating to the south and southwest. The results on<br />
the propagation direction of gravity waves are mainly related<br />
with the location of the gravity wave sources and also to the<br />
winds filtering processes below the airglow emission layer.<br />
b<br />
c<br />
Figure 2. Histogram plots for 74 gravity wave events characterized above<br />
Ferraz Station in 2010. The panels show the distribution of (A) horizontal<br />
wavelength, (B) observed period and (C) observed phase speed.<br />
Discussion and Conclusion<br />
The present work showed the statistics and characteristics of<br />
the gravity waves observed at Coman<strong>da</strong>nte Ferraz Antarctic<br />
Station (62.1° S and 58.4° W) during the austral winters of<br />
2010 and 2011. We presented the wave characteristics and<br />
propagation directions for the waves i<strong>de</strong>ntified in 2010.<br />
These results are similar to previous observations in Ferraz<br />
Station and in other sites around the Antarctic continent.<br />
The characteristics of the waves i<strong>de</strong>ntified during<br />
2011 are currently being analyzed, and the intrinsic wave<br />
parameters will be obtained for the full <strong>da</strong>ta set by using<br />
local mesospheric winds as obtained by a meteor ra<strong>da</strong>r.<br />
Future investigations will focus on gravity wave sources<br />
in the lower atmosphere through the reverse ray tracing<br />
mo<strong>de</strong>l, which makes use of the observed wave parameters,<br />
mesospheric winds obtained by meteor ra<strong>da</strong>r and mo<strong>de</strong>ls,<br />
temperatures <strong>de</strong>rived from satellite and reanalysis <strong>da</strong>ta, and<br />
meteorological satellite images.<br />
28 | Annual Activity Report 2011