1 - Instituto de Biologia da UFRJ
1 - Instituto de Biologia da UFRJ
1 - Instituto de Biologia da UFRJ

Create successful ePaper yourself
Turn your PDF publications into a flip-book with our unique Google optimized e-Paper software.
presented with different hatch colors. Each color represents a<br />
plant community as indicated in the subtitles of the Figures.<br />
The superposition of maps obtained can be un<strong>de</strong>rtaken<br />
through two different methods. By the differences between<br />
patch positions, patch areas and patch shapes revealed.<br />
On average the patch areas were bigger in the summer of<br />
2002/2003 than in the summer of 2009/2010, when the<br />
patch shapes show up totally different. But we can see that<br />
on average the patches of vegetation in 2010 appear in the<br />
same place as the patches of vegetation in 2003.<br />
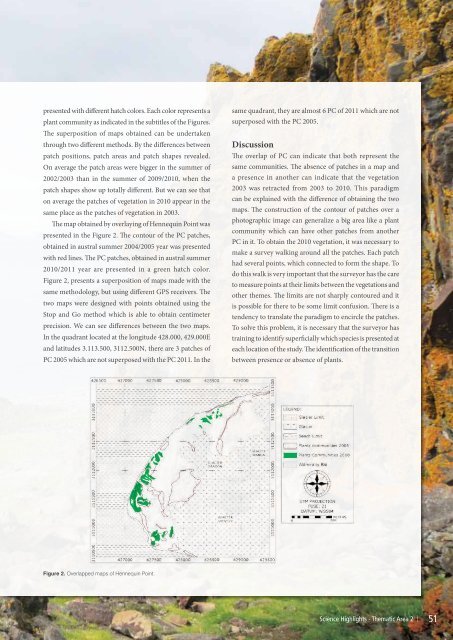
The map obtained by overlaying of Hennequin Point was<br />
presented in the Figure 2. The contour of the PC patches,<br />
obtained in austral summer 2004/2005 year was presented<br />
with red lines. The PC patches, obtained in austral summer<br />
2010/2011 year are presented in a green hatch color.<br />
Figure 2, presents a superposition of maps ma<strong>de</strong> with the<br />
same methodology, but using different GPS receivers. The<br />
two maps were <strong>de</strong>signed with points obtained using the<br />
Stop and Go method which is able to obtain centimeter<br />
precision. We can see differences between the two maps.<br />
In the quadrant located at the longitu<strong>de</strong> 428.000, 429.000E<br />
and latitu<strong>de</strong>s 3.113.500, 3112.500N, there are 3 patches of<br />
PC 2005 which are not superposed with the PC 2011. In the<br />
same quadrant, they are almost 6 PC of 2011 which are not<br />
superposed with the PC 2005.<br />
Discussion<br />
The overlap of PC can indicate that both represent the<br />
same communities. The absence of patches in a map and<br />
a presence in another can indicate that the vegetation<br />
2003 was retracted from 2003 to 2010. This paradigm<br />
can be explained with the difference of obtaining the two<br />
maps. The construction of the contour of patches over a<br />
photographic image can generalize a big area like a plant<br />
community which can have other patches from another<br />
PC in it. To obtain the 2010 vegetation, it was necessary to<br />
make a survey walking around all the patches. Each patch<br />
had several points, which connected to form the shape. To<br />
do this walk is very important that the surveyor has the care<br />
to measure points at their limits between the vegetations and<br />
other themes. The limits are not sharply contoured and it<br />
is possible for there to be some limit confusion. There is a<br />
ten<strong>de</strong>ncy to translate the paradigm to encircle the patches.<br />
To solve this problem, it is necessary that the surveyor has<br />
training to i<strong>de</strong>ntify superficially which species is presented at<br />
each location of the study. The i<strong>de</strong>ntification of the transition<br />
between presence or absence of plants.<br />
Figure 2. Overlapped maps of Hennequin Point.<br />
Science Highlights - Thematic Area 2 |<br />
51