- Page 2 and 3: Annual Activity Report 2011 Expedie
- Page 4 and 5: Cataloguing Card I59a Annual Activi
- Page 6 and 7: PRESENTATION National Institute of
- Page 8 and 9: 6 | Annual Activity Report 2011
- Page 10 and 11: Thematic Research Areas The Researc
- Page 12 and 13: introduction Advances In Brazilian
- Page 14: of soil contamination. At present,
- Page 18 and 19: THEMATIC AREA 1 ANTARCTIC ATMOSPHER
- Page 20 and 21: One of the most important propertie
- Page 22 and 23: 1 ATMOSPHERIC CHANGES OBSERVED IN A
- Page 24 and 25: the F2 layer critical frequency par
- Page 26 and 27: with the Gleissberg cycle (~90 year
- Page 28 and 29: 2 MESOSPHERIC GRAVITY WAVES OBSERVE
- Page 30 and 31: of 2011 (now under analysis). The h
- Page 32 and 33: 3 SYNOPTIC WEATHER SYSTEM ASSOCIATE
- Page 34 and 35: a b c Figure 2. Wind field daily av
- Page 36 and 37: 4 INFLUENCE OF THE ANTARCTIC OZONE
- Page 38 and 39: and New Zealand (Brinksma et al., 1
- Page 40 and 41: of Science, Technology and Innovati
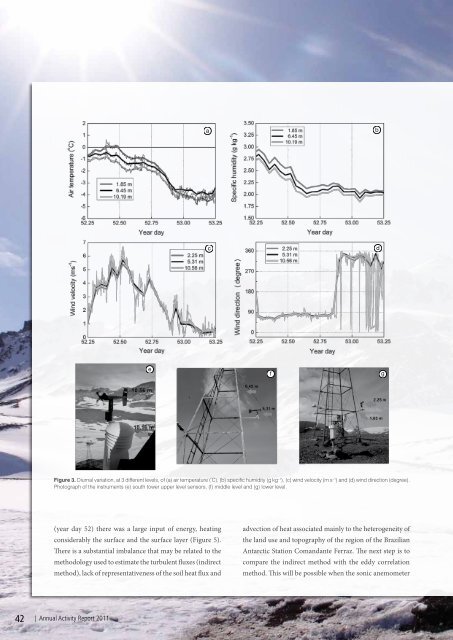
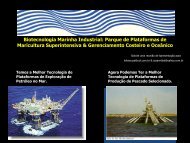
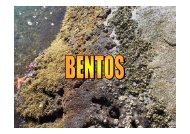
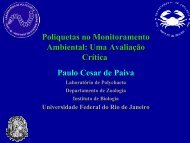
- Page 42 and 43: a b Figure 1. South tower of the Br
- Page 46 and 47: and infrared gas analyzer were setu
- Page 48 and 49: THEMATIC AREA 2 IMPACT OF GLOBAL CH
- Page 50 and 51: were widespread, reaching latitudes
- Page 52 and 53: GPS to reference the points in an a
- Page 54 and 55: Figure 2 can suggest that the 6 pat
- Page 56 and 57: Materials and Methods Phytossociolo
- Page 58 and 59: References Bednarek-Ochyra, H.; Van
- Page 60 and 61: level and parent material); vegetat
- Page 62 and 63: the soil organic matter levels. The
- Page 64 and 65: 4 CONSERVATION STATUS OF MOSS SPECI
- Page 66 and 67: Figure 1. The most frequent moss fo
- Page 68 and 69: Olech, M. (1996). Human impact on t
- Page 70 and 71: of apothecia or perithecia) were ma
- Page 72 and 73: Acknowledgements This work integrat
- Page 74 and 75: (Figure 1). There were found two sp
- Page 76 and 77: completely smooth hymenophore (Ager
- Page 78 and 79: Results The average SOI presented a
- Page 80 and 81: Table 1. ANCOVA results of demograp
- Page 82 and 83: 8 RESPONSES OF AN ANTARCTIC KELP GU
- Page 84 and 85: Figure 2. Average number of Kelp Gu
- Page 86 and 87: 9 Population fluctuation of Pygosce
- Page 88 and 89: winter habitat selection (Trivelpie
- Page 90 and 91: 10 FORAGING DISTRIBUTION OF AN ANTA
- Page 92 and 93: December and January) with a Repeat
- Page 94 and 95:
THEMATIC AREA 3 Impact of human act
- Page 96 and 97:
these two types of sewage markers,
- Page 98 and 99:
1 TEMPERATURE, SALINITY, PH, DISSOL
- Page 100 and 101:
Results In Table 1 we show the ocea
- Page 102 and 103:
Robakiewicz, M. & Rakusa-Suszczewsk
- Page 104 and 105:
we show the results from early summ
- Page 106 and 107:
a b c d Figure 2. Variations at dif
- Page 108 and 109:
3 SUMMER VARIATION OF ZOOPLANKTON C
- Page 110 and 111:
a b Figure 2. Mean numbers of holop
- Page 112 and 113:
Discussion Larval forms are common
- Page 114 and 115:
4 ASSESSMENT OF FAECAL POLLUTION IN
- Page 116 and 117:
Presence of C. perfringens in DCRM
- Page 118 and 119:
Figure 3. Most probable number and
- Page 120 and 121:
Leclerc, H.; Mossel, D. A.; Trinel.
- Page 122 and 123:
Figure 1. Map of the study region w
- Page 124 and 125:
Fourteen n-alkanols were identified
- Page 126 and 127:
Acknowledgements This work integrat
- Page 128 and 129:
treatment procedures that clean the
- Page 130 and 131:
Figure 2. Fecal sterols in marine s
- Page 132 and 133:
7 FRACTIONATION OF TRACE METALS AND
- Page 134 and 135:
a b Figure 1. Trace element mobile
- Page 136 and 137:
the National Council for Research a
- Page 138 and 139:
of humans (Bargagli et al., 1998).
- Page 140 and 141:
Farías, S.; Smichowski, P.; Velez,
- Page 142 and 143:
Materials and Methods In Admiralty
- Page 144 and 145:
stations. This alteration acts as a
- Page 146 and 147:
10 A baseline studies on plasmatic
- Page 148 and 149:
higher than ECO and PP, where as to
- Page 150 and 151:
11 Effect of diesel oil on gill enz
- Page 152 and 153:
Figure 1. Activity of enzymes hexok
- Page 154 and 155:
Regoli, F.; Principato, G.B.; Berto
- Page 156 and 157:
(Steneck et al., 2002), consisting
- Page 158 and 159:
Munnidae, Plakarthidae, Jaeropsidae
- Page 160 and 161:
13 TRACKING NON-NATIVE SPECIES IN T
- Page 162 and 163:
Table 1. Percentage of records in t
- Page 164 and 165:
References Carlton, J.T. (2009). De
- Page 166 and 167:
liverworts, lichens, algaes (Smykla
- Page 168 and 169:
a b c d Figure 2. Taxonomic details
- Page 170 and 171:
McInnes, S.J.; Chown, S.L.; Dartnal
- Page 172 and 173:
THEMATIC AREA 4 ENVIRONMENTAL MANAG
- Page 174 and 175:
1 RELATIONSHIP BETWEEN NOISE AND PS
- Page 176 and 177:
a b Figure 1. EACF acoustic mapping
- Page 178 and 179:
increases to 55 dB (A) the speech r
- Page 180 and 181:
2 ANALYSIS OF INDOOR ALDEHYDES IN T
- Page 182 and 183:
filtered and stored in vials, below
- Page 184 and 185:
formaldehyde concentration too. Des
- Page 186 and 187:
3 RESULTS OF THE INTERNAL AUDIT IN
- Page 188 and 189:
Figure 1. Requirements of ISO 14.00
- Page 190 and 191:
4 BIOREMEDIATION OF THE DIESEL-CONT
- Page 192 and 193:
Figure 1. Soil sampling points in t
- Page 194 and 195:
Bacteria a Archaea b c Microeukaryo
- Page 196 and 197:
EDUCATION AND OUTREACH ACTIVITIES D
- Page 198 and 199:
Informative and educational materia
- Page 200 and 201:
6. T-shirts: for each exhibition, t
- Page 202 and 203:
FACTS AND FIGURES Human Resources:
- Page 204 and 205:
publications Papers Bageston, J.V.;
- Page 206 and 207:
Fanticele, F. B. Avaliação de con
- Page 208 and 209:
e-mails inct - apa reserach team Th
- Page 210 and 211:
Dr. Márcia Caruso Bícego (IOUSP)
- Page 212:
Tecnologista Heber Passos (INPE/INC
- Page 215:
Instituto Nacional de Ciência e Te