Elektronika 2009-11.pdf - Instytut Systemów Elektronicznych
Elektronika 2009-11.pdf - Instytut Systemów Elektronicznych
Elektronika 2009-11.pdf - Instytut Systemów Elektronicznych

You also want an ePaper? Increase the reach of your titles
YUMPU automatically turns print PDFs into web optimized ePapers that Google loves.
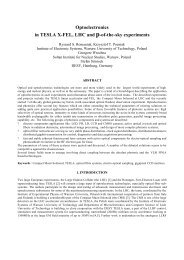
Considering human visual perception<br />
for determination of distortion<br />
One of the indicators defining the quality of images and the<br />
level of introduced distortions is a coefficient PSNR (Peak Signal<br />
to Noise Ratio). Good quality images with hidden messages<br />
have the coefficient of PSNR ≥ 30 [4]. The<br />
disadvantage of this index is low correlation with visual perception<br />
of a recipient. In studies of human vision for evaluation<br />
of the quality of vision two measures are used: visual acuity<br />
and contrast threshold [5].<br />
Visual acuity, called VISUS determines the size of the smallest<br />
character called optotype, which is correctly recognized by<br />
human from a certain distance. This measure determines the<br />
fraction of Sandella, which is the quotient of the distance from<br />
the test chart to the distance from which the optotype is recognized<br />
at 5 minutes angle. Visus measure equals 5/5 signifies<br />
correct human sight. If Sandella fraction is 5/15 it means person<br />
with poor sight. [5]. If the visual acuity is 1 (6/6) then the spatial<br />
frequency is 20/20 cycle/degree. If the visual acuity is 0.1 (6/60)<br />
then the spatial frequency is 20/200 cycle/degree.<br />
Examination of visual acuity is held at maximum contrast,<br />
where optotype having a black color is placed on a white<br />
background. Because the conditions of the observation usually<br />
do not allow the observations at maximum contrast therefore<br />
more important measure for determining the quality of<br />
sight is the contrast [5].<br />
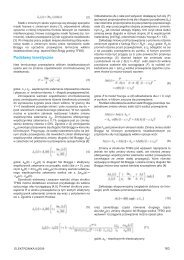
Contrast characterizes the degree of distinguishing of the<br />
subject from the background and the clarity of its details. Contrast<br />
measure can be calculated based on relation (Michaelson’s):<br />
(1)<br />
2.5%, 1.25%, 0.6%. In this way optotype chart is used for<br />
examining the acuity as a chart for examining the sensitivity of<br />
an eye to changes of contrast. If recognized contrast is 2.5%<br />
then contrast sensitivity is 100/2.5 = 40 and if it is 0.6% equals<br />
100/0.6 = 167 respectively.<br />
The changes of contrast are noticeable between the acuity<br />
values of 0 (high optotype symbols) and 1 (small optotypes).<br />
All changes in contrast above 1 (20/20 cycle/degree)<br />
are imperceptible. Hiding information in the area above<br />
1 cycle/degree does not lead to visible distortions in the resulting<br />
image. The biggest changes are noticeable in the area<br />
of visual acuity for optotypes 0.03 (20/600) and 0.1 (20/200),<br />
where the contrast sensitivity is the greatest.<br />
A modified form of the determination of invisibility to the<br />
human eye of the fact of steganographic hidden messages in<br />
pictures is the utilization of standardized contrast sensitivity<br />
function CSF proposed by Manos and Sakrisona [8]. This<br />
function is defined in formula:<br />
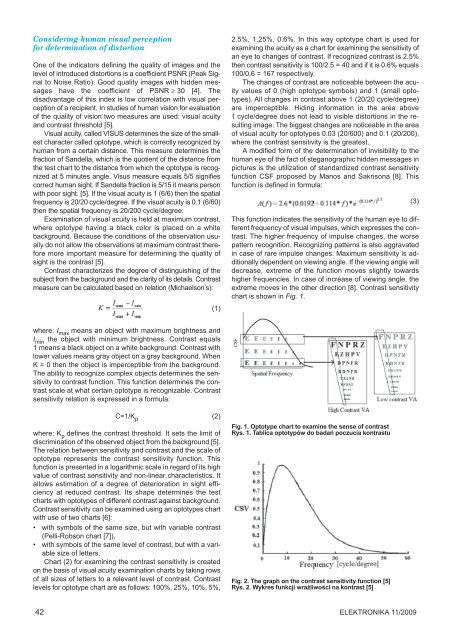
This function indicates the sensitivity of the human eye to different<br />
frequency of visual impulses, which expresses the contrast.<br />
The higher frequency of impulse changes, the worse<br />
pattern recognition. Recognizing patterns is also aggravated<br />
in case of rare impulse changes. Maximum sensitivity is additionally<br />
dependent on viewing angle. If the viewing angle will<br />
decrease, extreme of the function moves slightly towards<br />
higher frequencies. In case of increase of viewing angle, the<br />
extreme moves in the other direction [8]. Contrast sensitivity<br />
chart is shown in Fig. 1.<br />
(3)<br />
where: I max means an object with maximum brightness and<br />
I min the object with minimum brightness. Contrast equals<br />
1 means a black object on a white background. Contrast with<br />
lower values means gray object on a gray background. When<br />
K = 0 then the object is imperceptible from the background.<br />
The ability to recognize complex objects determines the sensitivity<br />
to contrast function. This function determines the contrast<br />
scale at what certain optotype is recognizable. Contrast<br />
sensitivity relation is expressed in a formula:<br />
C=1/K p (2)<br />
where: K p defines the contrast threshold. It sets the limit of<br />
discrimination of the observed object from the background [5].<br />
The relation between sensitivity and contrast and the scale of<br />
optotype represents the contrast sensitivity function. This<br />
function is presented in a logarithmic scale in regard of its high<br />
value of contrast sensitivity and non-linear characteristics. It<br />
allows estimation of a degree of deterioration in sight efficiency<br />
at reduced contrast. Its shape determines the test<br />
charts with optotypes of different contrast against background.<br />
Contrast sensitivity can be examined using an optotypes chart<br />
with use of two charts [6]:<br />
• with symbols of the same size, but with variable contrast<br />
(Pelli-Robson chart [7]),<br />
• with symbols of the same level of contrast, but with a variable<br />
size of letters.<br />
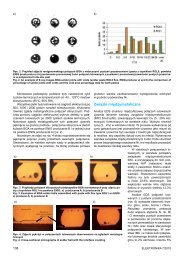
Chart (2) for examining the contrast sensitivity is created<br />
on the basis of visual acuity examination charts by taking rows<br />
of all sizes of letters to a relevant level of contrast. Contrast<br />
levels for optotype chart are as follows: 100%, 25%, 10%, 5%,<br />
Fig. 1. Optotype chart to examine the sense of contrast<br />
Rys. 1. Tablica optotypów do badań poczucia kontrastu<br />
Fig. 2. The graph on the contrast sensitivity function [5]<br />
Rys. 2. Wykres funkcji wrażliwości na kontrast [5]<br />
42 ELEKTRONIKA 11/<strong>2009</strong>