Elektronika 2009-11.pdf - Instytut Systemów Elektronicznych
Elektronika 2009-11.pdf - Instytut Systemów Elektronicznych
Elektronika 2009-11.pdf - Instytut Systemów Elektronicznych

You also want an ePaper? Increase the reach of your titles
YUMPU automatically turns print PDFs into web optimized ePapers that Google loves.
k = 1, 2, ..., m and m is the number of elements in Ρ k (m is<br />
less or equal to 360). Then, the normalisation of elements in<br />
vector Ρ k is performed [2]:<br />
The elements in Ρ k are assigned to bins in histogram (ρ k to l k ) [2]:<br />
where r is the predetermined number of bins.<br />
The next step is the normalisation of the values in bins,<br />
according to the highest one [2]:<br />
(5)<br />
(6)<br />
(7)<br />
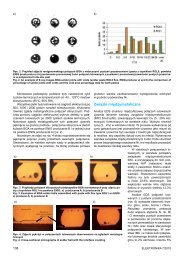
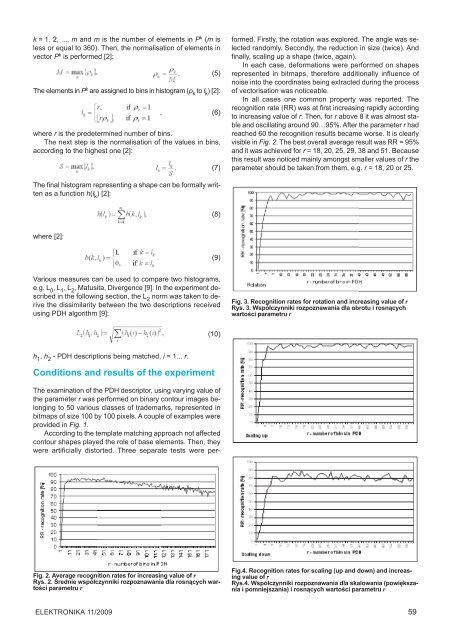
The examination of the PDH descriptor, using varying value of<br />
the parameter r was performed on binary contour images belonging<br />
to 50 various classes of trademarks, represented in<br />
bitmaps of size 100 by 100 pixels. A couple of examples were<br />
provided in Fig. 1.<br />
According to the template matching approach not affected<br />
contour shapes played the role of base elements. Then, they<br />
were artificially distorted. Three separate tests were performed.<br />
Firstly, the rotation was explored. The angle was selected<br />
randomly. Secondly, the reduction in size (twice). And<br />
finally, scaling up a shape (twice, again).<br />
In each case, deformations were performed on shapes<br />
represented in bitmaps, therefore additionally influence of<br />
noise into the coordinates being extracted during the process<br />
of vectorisation was noticeable.<br />
In all cases one common property was reported. The<br />
recognition rate (RR) was at first increasing rapidly according<br />
to increasing value of r. Then, for r above 8 it was almost stable<br />
and oscillating around 90…95%. After the parameter r had<br />
reached 60 the recognition results became worse. It is clearly<br />
visible in Fig. 2. The best overall average result was RR = 95%<br />
and it was achieved for r = 18, 20, 25, 29, 38 and 51. Because<br />
this result was noticed mainly amongst smaller values of r the<br />
parameter should be taken from them, e.g. r = 18, 20 or 25.<br />
The final histogram representing a shape can be formally written<br />
as a function h(l k ) [2]:<br />
(8)<br />
where [2]:<br />
(9)<br />
Various measures can be used to compare two histograms,<br />
e.g. L 0 , L 1 , L 2 , Matusita, Divergence [9]. In the experiment described<br />
in the following section, the L 2 norm was taken to derive<br />
the dissimilarity between the two descriptions received<br />
using PDH algorithm [9]:<br />
Fig. 3. Recognition rates for rotation and increasing value of r<br />
Rys. 3. Współczynniki rozpoznawania dla obrotu i rosnących<br />
wartości parametru r<br />
(10)<br />
h 1 , h 2 - PDH descriptions being matched, i = 1... r.<br />
Conditions and results of the experiment<br />
Fig. 2. Average recognition rates for increasing value of r<br />
Rys. 2. Średnie współczynniki rozpoznawania dla rosnących wartości<br />
parametru r<br />
Fig.4. Recognition rates for scaling (up and down) and increasing<br />
value of r<br />
Rys.4. Współczynniki rozpoznawania dla skalowania (powiększania<br />
i pomniejszania) i rosnących wartości parametru r<br />
ELEKTRONIKA 11/<strong>2009</strong> 59