(IVAR) - Final Report - Strategic Environmental Research and ...
(IVAR) - Final Report - Strategic Environmental Research and ...
(IVAR) - Final Report - Strategic Environmental Research and ...
Create successful ePaper yourself
Turn your PDF publications into a flip-book with our unique Google optimized e-Paper software.
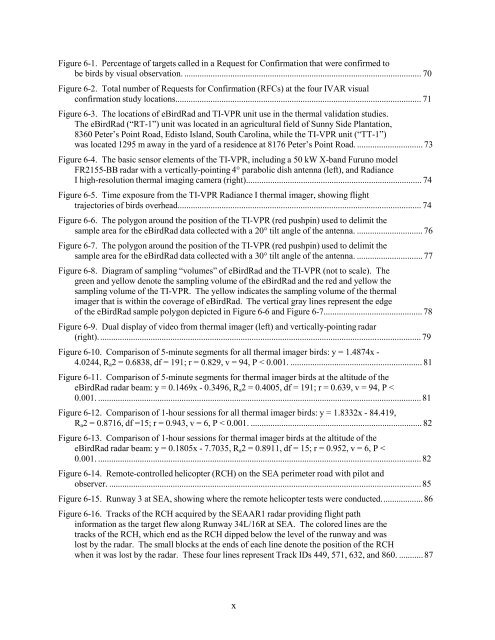
Figure 6-1. Percentage of targets called in a Request for Confirmation that were confirmed to<br />
be birds by visual observation. ............................................................................................................ 70<br />
Figure 6-2. Total number of Requests for Confirmation (RFCs) at the four <strong>IVAR</strong> visual<br />
confirmation study locations................................................................................................................ 71<br />
Figure 6-3. The locations of eBirdRad <strong>and</strong> TI-VPR unit use in the thermal validation studies.<br />
The eBirdRad (“RT-1”) unit was located in an agricultural field of Sunny Side Plantation,<br />
8360 Peter’s Point Road, Edisto Isl<strong>and</strong>, South Carolina, while the TI-VPR unit (“TT-1”)<br />
was located 1295 m away in the yard of a residence at 8176 Peter’s Point Road. .............................. 73<br />
Figure 6-4. The basic sensor elements of the TI-VPR, including a 50 kW X-b<strong>and</strong> Furuno model<br />
FR2155-BB radar with a vertically-pointing 4° parabolic dish antenna (left), <strong>and</strong> Radiance<br />
I high-resolution thermal imaging camera (right)................................................................................ 74<br />
Figure 6-5. Time exposure from the TI-VPR Radiance I thermal imager, showing flight<br />
trajectories of birds overhead............................................................................................................... 74<br />
Figure 6-6. The polygon around the position of the TI-VPR (red pushpin) used to delimit the<br />
sample area for the eBirdRad data collected with a 20° tilt angle of the antenna. .............................. 76<br />
Figure 6-7. The polygon around the position of the TI-VPR (red pushpin) used to delimit the<br />
sample area for the eBirdRad data collected with a 30° tilt angle of the antenna. .............................. 77<br />
Figure 6-8. Diagram of sampling “volumes” of eBirdRad <strong>and</strong> the TI-VPR (not to scale). The<br />
green <strong>and</strong> yellow denote the sampling volume of the eBirdRad <strong>and</strong> the red <strong>and</strong> yellow the<br />
sampling volume of the TI-VPR. The yellow indicates the sampling volume of the thermal<br />
imager that is within the coverage of eBirdRad. The vertical gray lines represent the edge<br />
of the eBirdRad sample polygon depicted in Figure 6-6 <strong>and</strong> Figure 6-7............................................. 78<br />
Figure 6-9. Dual display of video from thermal imager (left) <strong>and</strong> vertically-pointing radar<br />
(right). .................................................................................................................................................. 79<br />
Figure 6-10. Comparison of 5-minute segments for all thermal imager birds: y = 1.4874x -<br />
4.0244, R a 2 = 0.6838, df = 191; r = 0.829, v = 94, P < 0.001. ............................................................ 81<br />
Figure 6-11. Comparison of 5-minute segments for thermal imager birds at the altitude of the<br />
eBirdRad radar beam: y = 0.1469x - 0.3496, R a 2 = 0.4005, df = 191; r = 0.639, v = 94, P <<br />
0.001. ................................................................................................................................................... 81<br />
Figure 6-12. Comparison of 1-hour sessions for all thermal imager birds: y = 1.8332x - 84.419,<br />
R a 2 = 0.8716, df =15; r = 0.943, v = 6, P < 0.001. .............................................................................. 82<br />
Figure 6-13. Comparison of 1-hour sessions for thermal imager birds at the altitude of the<br />
eBirdRad radar beam: y = 0.1805x - 7.7035, R a 2 = 0.8911, df = 15; r = 0.952, v = 6, P <<br />
0.001. ................................................................................................................................................... 82<br />
Figure 6-14. Remote-controlled helicopter (RCH) on the SEA perimeter road with pilot <strong>and</strong><br />
observer. .............................................................................................................................................. 85<br />
Figure 6-15. Runway 3 at SEA, showing where the remote helicopter tests were conducted. .................. 86<br />
Figure 6-16. Tracks of the RCH acquired by the SEAAR1 radar providing flight path<br />
information as the target flew along Runway 34L/16R at SEA. The colored lines are the<br />
tracks of the RCH, which end as the RCH dipped below the level of the runway <strong>and</strong> was<br />
lost by the radar. The small blocks at the ends of each line denote the position of the RCH<br />
when it was lost by the radar. These four lines represent Track IDs 449, 571, 632, <strong>and</strong> 860. ........... 87<br />
x


