(IVAR) - Final Report - Strategic Environmental Research and ...
(IVAR) - Final Report - Strategic Environmental Research and ...
(IVAR) - Final Report - Strategic Environmental Research and ...
You also want an ePaper? Increase the reach of your titles
YUMPU automatically turns print PDFs into web optimized ePapers that Google loves.
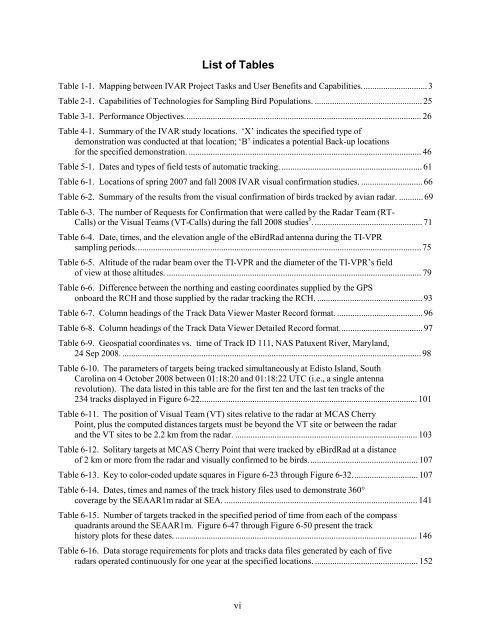
List of Tables<br />
Table 1-1. Mapping between <strong>IVAR</strong> Project Tasks <strong>and</strong> User Benefits <strong>and</strong> Capabilities.............................. 3<br />
Table 2-1. Capabilities of Technologies for Sampling Bird Populations. ................................................. 25<br />
Table 3-1. Performance Objectives............................................................................................................ 26<br />
Table 4-1. Summary of the <strong>IVAR</strong> study locations. ‘X’ indicates the specified type of<br />
demonstration was conducted at that location; ‘B’ indicates a potential Back-up locations<br />
for the specified demonstration. .......................................................................................................... 46<br />
Table 5-1. Dates <strong>and</strong> types of field tests of automatic tracking. ................................................................ 61<br />
Table 6-1. Locations of spring 2007 <strong>and</strong> fall 2008 <strong>IVAR</strong> visual confirmation studies. ............................ 66<br />
Table 6-2. Summary of the results from the visual confirmation of birds tracked by avian radar. ........... 69<br />
Table 6-3. The number of Requests for Confirmation that were called by the Radar Team (RT-<br />
Calls) or the Visual Teams (VT-Calls) during the fall 2008 studies 5 . ................................................. 71<br />
Table 6-4. Date, times, <strong>and</strong> the elevation angle of the eBirdRad antenna during the TI-VPR<br />
sampling periods. ................................................................................................................................. 75<br />
Table 6-5. Altitude of the radar beam over the TI-VPR <strong>and</strong> the diameter of the TI-VPR’s field<br />
of view at those altitudes. .................................................................................................................... 79<br />
Table 6-6. Difference between the northing <strong>and</strong> easting coordinates supplied by the GPS<br />
onboard the RCH <strong>and</strong> those supplied by the radar tracking the RCH. ................................................ 93<br />
Table 6-7. Column headings of the Track Data Viewer Master Record format. ....................................... 96<br />
Table 6-8. Column headings of the Track Data Viewer Detailed Record format...................................... 97<br />
Table 6-9. Geospatial coordinates vs. time of Track ID 111, NAS Patuxent River, Maryl<strong>and</strong>,<br />
24 Sep 2008. ........................................................................................................................................ 98<br />
Table 6-10. The parameters of targets being tracked simultaneously at Edisto Isl<strong>and</strong>, South<br />
Carolina on 4 October 2008 between 01:18:20 <strong>and</strong> 01:18:22 UTC (i.e., a single antenna<br />
revolution). The data listed in this table are for the first ten <strong>and</strong> the last ten tracks of the<br />
234 tracks displayed in Figure 6-22................................................................................................... 101<br />
Table 6-11. The position of Visual Team (VT) sites relative to the radar at MCAS Cherry<br />
Point, plus the computed distances targets must be beyond the VT site or between the radar<br />
<strong>and</strong> the VT sites to be 2.2 km from the radar. ................................................................................... 103<br />
Table 6-12. Solitary targets at MCAS Cherry Point that were tracked by eBirdRad at a distance<br />
of 2 km or more from the radar <strong>and</strong> visually confirmed to be birds. ................................................. 107<br />
Table 6-13. Key to color-coded update squares in Figure 6-23 through Figure 6-32. ............................. 107<br />
Table 6-14. Dates, times <strong>and</strong> names of the track history files used to demonstrate 360°<br />
coverage by the SEAAR1m radar at SEA. ........................................................................................ 141<br />
Table 6-15. Number of targets tracked in the specified period of time from each of the compass<br />
quadrants around the SEAAR1m. Figure 6-47 through Figure 6-50 present the track<br />
history plots for these dates. .............................................................................................................. 146<br />
Table 6-16. Data storage requirements for plots <strong>and</strong> tracks data files generated by each of five<br />
radars operated continuously for one year at the specified locations. ............................................... 152<br />
vi


