- Page 1 and 2:
FINAL REPORT Integration and Valida
- Page 3 and 4:
Table of Contents List of Tables ..
- Page 5 and 6:
APPENDIX A. POINTS OF CONTACT .....
- Page 7 and 8:
Table 6-17. Altitudinal distributio
- Page 9 and 10:
List of Figures Figure 2-1. Chronol
- Page 11 and 12:
Figure 6-17. Plot of the northing c
- Page 13 and 14:
Figure 6-42. eBirdRad display based
- Page 15 and 16:
Figure 6-82. Hourly track count ove
- Page 17 and 18:
Figure 6-115: COP display showing f
- Page 19 and 20:
List of Acronyms Acronym AGL AIP AR
- Page 21 and 22:
Acronym RST RT SEA SQL SSC Pacific
- Page 23 and 24:
Carmen Lombardo Naval Air Station,
- Page 25 and 26:
EXECUTIVE SUMMARY Military bases an
- Page 27 and 28:
database and redistributed to other
- Page 29 and 30:
1 INTRODUCTION 1.1 BACKGROUND Encro
- Page 31 and 32:
A seventh objective, the Functional
- Page 33 and 34:
Table 1-1 (cont.). IVAR TASK/ OBJEC
- Page 35 and 36:
environmental stewardship with miss
- Page 37 and 38:
2 TECHNOLOGY/METHODOLOGY DESCRIPTIO
- Page 39 and 40:
The original BirdRad system was des
- Page 41 and 42:
2.4 TECHNOLOGY/METHODOLOGY DEVELOPM
- Page 43 and 44:
Figure 2-2. Configuration of BirdRa
- Page 45 and 46:
2.4.3 eBirdRad - Digital Radars wit
- Page 47 and 48:
Figure 2-5. Interior view of the eB
- Page 49 and 50:
accuracy and target continuity over
- Page 51 and 52:
permanently installed at SEA. Prior
- Page 53 and 54:
2.5 ADVANTAGES AND LIMITATIONS OF T
- Page 55 and 56: 3 PERFORMANCE OBJECTIVES Table 3-1
- Page 57 and 58: Table 3-1 (cont.). Performance Obje
- Page 59 and 60: Table 3-1 (cont.). Performance Obje
- Page 61 and 62: Table 3-1 (cont.). Performance Obje
- Page 63 and 64: Table 3-1 (cont.). Performance Obje
- Page 65 and 66: For the third test, Validation Usin
- Page 67 and 68: temporal domain by recording all bi
- Page 69 and 70: 3.1.2.2.7 Provides Bird Abundance o
- Page 71 and 72: difference in the time (i.e., the l
- Page 73 and 74: 3.1.6.2.4 Maintenance [SE4.2] We es
- Page 75 and 76: Table 4-1. Summary of the IVAR stud
- Page 77 and 78: 4.1 MCAS CHERRY POINT Marine Corps
- Page 79 and 80: 2006 the primary eBirdRad unit from
- Page 81 and 82: (directional WiFi) to the Internet.
- Page 83 and 84: • Large (several thousand) flocks
- Page 85 and 86: location for demonstrating the capa
- Page 87 and 88: 5.1 CONCEPTUAL TEST DESIGN 5 TEST D
- Page 89 and 90: 5.3 DESIGN AND LAYOUT OF TECHNOLOGY
- Page 91 and 92: Assuming these lines evidence confi
- Page 93 and 94: that dataset [Section 6.5.1.3]. 5.5
- Page 95 and 96: 6 PERFORMANCE ASSESSMENT The Perfor
- Page 97 and 98: ecord the time, Track ID, and other
- Page 99 and 100: Figure 6-1. Percentage of targets c
- Page 101 and 102: Comparing the performance of dish v
- Page 103 and 104: Figure 6-4. The basic sensor elemen
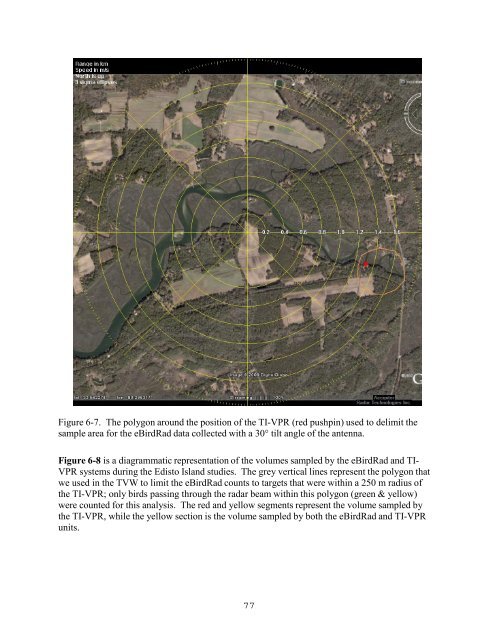
- Page 105: Figure 6-6. The polygon around the
- Page 109 and 110: • It takes several scans (nominal
- Page 111 and 112: Session Correla tions 600 500 y = 1
- Page 113 and 114: To evaluate the capabilities of the
- Page 115 and 116: Figure 6-15. Runway 3 at SEA, showi
- Page 117 and 118: comparisons between the RCH-GPS dat
- Page 119 and 120: Figure 6-18. Plot of the northing c
- Page 121 and 122: Figure 6-20. Plot of the easting co
- Page 123 and 124: Conclusion In the quantitative perf
- Page 125 and 126: Table 6-8. Column headings of the T
- Page 127 and 128: Table 6-9 demonstrates quantitative
- Page 129 and 130: Table 6-10. The parameters of targe
- Page 131 and 132: Table 6-11. The position of Visual
- Page 133 and 134: Table 6-12. Solitary targets at MCA
- Page 135 and 136: Figure 6-23. The track of target T2
- Page 137 and 138: Figure 6-25. The track of target T2
- Page 139 and 140: Figure 6-27. The track of target T5
- Page 141 and 142: Figure 6-29. The track of target T5
- Page 143 and 144: Figure 6-31. The track of target T2
- Page 145 and 146: intended to demonstrate these syste
- Page 147 and 148: Figure 6-34. Screen capture of bird
- Page 149 and 150: 6.1.2 Qualitative Performance Crite
- Page 151 and 152: upper right have completely converg
- Page 153 and 154: Figure 6-38. The progression of the
- Page 155 and 156: The slight difference in alignment
- Page 157 and 158:
Figure 6-42. eBirdRad display based
- Page 159 and 160:
Figure 6-44. A partial history of t
- Page 161 and 162:
6.2 SAMPLING PROTOCOL 6.2.1 Quantit
- Page 163 and 164:
Figure 6-46. Image from the track h
- Page 165 and 166:
Table 6-14. Dates, times and names
- Page 167 and 168:
Figure 6-48. Fifteen-minute (06:04-
- Page 169 and 170:
Figure 6-50. Fifteen-minute (02:24-
- Page 171 and 172:
We used a TVW to process the plots
- Page 173 and 174:
Figure 6-53. In an example of night
- Page 175 and 176:
6.2.1.4 Efficiently Stores Bird Tra
- Page 177 and 178:
Figure 6-56 shows sites 13-24 in th
- Page 179 and 180:
We extracted the radar data for thi
- Page 181 and 182:
Figure 6-57. Digital image of the d
- Page 183 and 184:
Table 6-17. Altitudinal distributio
- Page 185 and 186:
hours apart, showed considerable va
- Page 187 and 188:
• The sampling event time period
- Page 189 and 190:
underwent a 4-minute initialization
- Page 191 and 192:
Figure 6-62. DRP Live application l
- Page 193 and 194:
commands we issued to the radar; th
- Page 195 and 196:
4. Range Decrease (x7) 5. Range Inc
- Page 197 and 198:
Figure 6-65, Figure 6-66, and Figur
- Page 199 and 200:
6.2.2.4 Provides Spatial Distributi
- Page 201 and 202:
Figure 6-69. A plot of all track ac
- Page 203 and 204:
Figure 6-71. Twelve 2-hour historie
- Page 205 and 206:
Figure 6-72. TVW application displa
- Page 207 and 208:
Conclusion Figure 6-74. Oblique vie
- Page 209 and 210:
Archived Data to a GIS We used the
- Page 211 and 212:
(SQL). Extracting target data from
- Page 213 and 214:
Figure 6-78. Daily, unfiltered, tra
- Page 215 and 216:
Figure 6-79. Time periods selected
- Page 217 and 218:
Figure 6-82. Hourly track count ove
- Page 219 and 220:
esults are displayed in Figure 6-83
- Page 221 and 222:
As can be seen in Figure 6-83, the
- Page 223 and 224:
Figure 6-84 clearly demonstrates th
- Page 225 and 226:
Conclusion We have successfully dem
- Page 227 and 228:
LAN within a facility to the operat
- Page 229 and 230:
All reference times were recorded i
- Page 231 and 232:
Description of Remote Display - As
- Page 233 and 234:
mounted laptop computer (Figure 6-8
- Page 235 and 236:
very good because the system was sa
- Page 237 and 238:
operations personnel or their contr
- Page 239 and 240:
Figure 6-90. Alarm status pane and
- Page 241 and 242:
Figure 6-92. Alarm triggered as a f
- Page 243 and 244:
Figure 6-95. Screen capture of the
- Page 245 and 246:
Figure 6-96. An example from a data
- Page 247 and 248:
Table 6-29. Differences found betwe
- Page 249 and 250:
6.4 DATA INTEGRATION 6.4.1 Quantita
- Page 251 and 252:
Figure 6-100. Screen captures for S
- Page 253 and 254:
We used a screen-capture program at
- Page 255 and 256:
Results Table 6-32 records the time
- Page 257 and 258:
We acquired the appropriate plots a
- Page 259 and 260:
Figure 6-105. Track histories of ta
- Page 261 and 262:
synchronized, both spatially and te
- Page 263 and 264:
0.004687 seconds ahead of the NTP t
- Page 265 and 266:
Figure 6-108: COP display showing f
- Page 267 and 268:
Figure 6-110: TVW display showing t
- Page 269 and 270:
The next example from NASWI involve
- Page 271 and 272:
Figure 6-114: TVW display showing t
- Page 273 and 274:
Figure 6-116: COP display showing a
- Page 275 and 276:
Fusion processing was enabled in th
- Page 277 and 278:
processing associated with this dat
- Page 279 and 280:
Figure 6-122: Track IDs shown for b
- Page 281 and 282:
Conclusion We successfully demonstr
- Page 283 and 284:
Of course, many other factors contr
- Page 285 and 286:
one, Jim Swift, had been exposed to
- Page 287 and 288:
Methods The US military 27 designat
- Page 289 and 290:
Natural R.esoan:es Br.mch 22541Jolm
- Page 291 and 292:
Given these considerations, the IVA
- Page 293 and 294:
Results No maintenance was required
- Page 295 and 296:
acquired and is testing JRC S-band
- Page 297 and 298:
areas of overlap. Data fusion algor
- Page 299 and 300:
6.8 FUNCTIONAL REQUIREMENTS AND PER
- Page 301 and 302:
Table 7-1. Cost Model for a Standal
- Page 303 and 304:
additional processors account of th
- Page 305 and 306:
Installation Site Assessment - Rada
- Page 307 and 308:
e incurred, depending on what infor
- Page 309 and 310:
eal time, avian radars and can dete
- Page 311 and 312:
Network Connectivity. The US Depart
- Page 313 and 314:
Airport Improvement Program (AIP) f
- Page 315 and 316:
9 REFERENCES Anderson, C., and S. O
- Page 317 and 318:
APPENDIX A. POINTS OF CONTACT POINT
- Page 319 and 320:
POINT OF CONTACT Name Ryan King Mat
- Page 321 and 322:
APPENDIX B. ANALYTICAL METHODS SUPP
- Page 323 and 324:
METHOD #2: VALIDATION BY IMAGE COMP
- Page 325 and 326:
The pattern of yellows and blues in
- Page 327 and 328:
Radar Team (RT) Site Selection Sinc
- Page 329 and 330:
will measured the magnetic bearing
- Page 331 and 332:
Figure B-6. Using a GPS to record s
- Page 333 and 334:
• Visual Observer - observes bird
- Page 335 and 336:
Figure B-9. Flowchart of target con
- Page 337 and 338:
VT: “Radar, Team 2-Alpha copies T
- Page 339 and 340:
eam and the VTs have difficulty loc
- Page 341 and 342:
why it was changed, who made the ch
- Page 343 and 344:
METHOD #4: CONFIRMATION OF BIRD TAR
- Page 345 and 346:
Figure B-12. Duplexed image showing
- Page 347 and 348:
Table B-2. Dates, times, and antenn
- Page 349 and 350:
For the analysis of the simultaneou
- Page 351 and 352:
Table B-3. Altitude of the radar be
- Page 353 and 354:
Figure B-17. Diagram of sampling
- Page 355 and 356:
METHOD #6: DEMONSTRATING REAL-TIME
- Page 357 and 358:
APPENDIX C. DATA QUALITY ASSURANCE/
- Page 359 and 360:
APPENDIX D. SUPPORTING DATA D.1 Par
- Page 361 and 362:
Table D-1 (cont.). Date Track ID Up
- Page 363 and 364:
Table D-1 (cont.). Date Track ID Up
- Page 365 and 366:
Table D-1 (cont.). Date Track ID Up
- Page 367 and 368:
D.2 Listing of One-Hour Track Histo
- Page 369 and 370:
Table D-2 (cont.). 07:00-08:00 WI_A
- Page 371 and 372:
APPENDIX E. SURVEY OF AIRPORT PERSO
- Page 373 and 374:
used as the real-time target becaus
- Page 375 and 376:
Table E-1. Remote radar display lat
- Page 377:
7. Please rate the following where


