Series 04 Ku-Band TVRO Antenna
Series 04 Ku-Band TVRO Antenna
Series 04 Ku-Band TVRO Antenna

Create successful ePaper yourself
Turn your PDF publications into a flip-book with our unique Google optimized e-Paper software.
Troubleshooting and Maintenance<br />
<strong>Series</strong> <strong>04</strong> <strong>Ku</strong>-<strong>Band</strong> <strong>TVRO</strong> <strong>Antenna</strong><br />
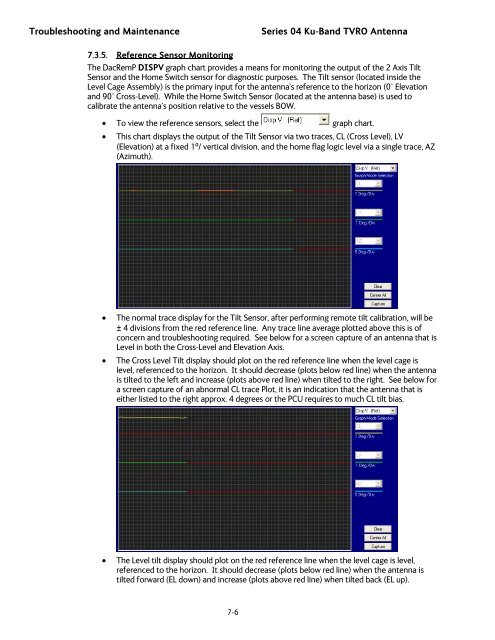
7.3.5. Reference Sensor Monitoring<br />
The DacRemP DISPV graph chart provides a means for monitoring the output of the 2 Axis Tilt<br />
Sensor and the Home Switch sensor for diagnostic purposes. The Tilt sensor (located inside the<br />
Level Cage Assembly) is the primary input for the antenna’s reference to the horizon (0° Elevation<br />
and 90° Cross-Level). While the Home Switch Sensor (located at the antenna base) is used to<br />
calibrate the antenna’s position relative to the vessels BOW.<br />
• To view the reference sensors, select the graph chart.<br />
• This chart displays the output of the Tilt Sensor via two traces, CL (Cross Level), LV<br />
(Elevation) at a fixed 1º/ vertical division, and the home flag logic level via a single trace, AZ<br />
(Azimuth).<br />
• The normal trace display for the Tilt Sensor, after performing remote tilt calibration, will be<br />
± 4 divisions from the red reference line. Any trace line average plotted above this is of<br />
concern and troubleshooting required. See below for a screen capture of an antenna that is<br />
Level in both the Cross-Level and Elevation Axis.<br />
• The Cross Level Tilt display should plot on the red reference line when the level cage is<br />
level, referenced to the horizon. It should decrease (plots below red line) when the antenna<br />
is tilted to the left and increase (plots above red line) when tilted to the right. See below for<br />
a screen capture of an abnormal CL trace Plot, it is an indication that the antenna that is<br />
either listed to the right approx. 4 degrees or the PCU requires to much CL tilt bias.<br />
• The Level tilt display should plot on the red reference line when the level cage is level,<br />
referenced to the horizon. It should decrease (plots below red line) when the antenna is<br />
tilted forward (EL down) and increase (plots above red line) when tilted back (EL up).<br />
7-6

![NC1147 (pdf 1.47 mb) Nitrogen Concentrator [OBIGGS] - Cobham plc](https://img.yumpu.com/51124104/1/190x245/nc1147-pdf-147-mb-nitrogen-concentrator-obiggs-cobham-plc.jpg?quality=85)