Series 04 Ku-Band TVRO Antenna
Series 04 Ku-Band TVRO Antenna
Series 04 Ku-Band TVRO Antenna

Create successful ePaper yourself
Turn your PDF publications into a flip-book with our unique Google optimized e-Paper software.
<strong>Series</strong> <strong>04</strong> <strong>Ku</strong>-<strong>Band</strong> <strong>TVRO</strong> <strong>Antenna</strong><br />
Troubleshooting and Maintenance<br />
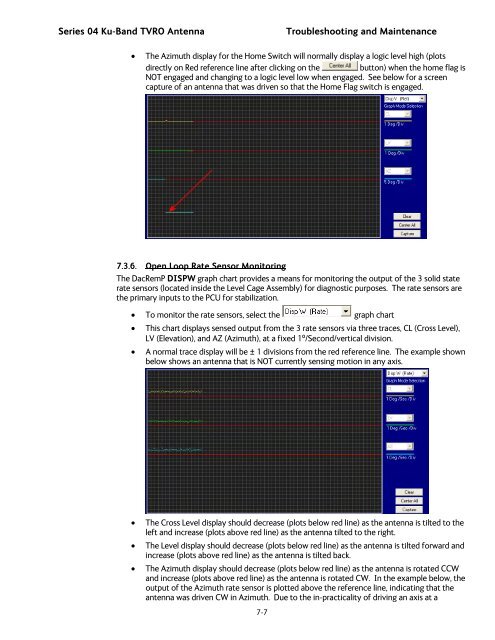
• The Azimuth display for the Home Switch will normally display a logic level high (plots<br />
directly on Red reference line after clicking on the<br />
button) when the home flag is<br />
NOT engaged and changing to a logic level low when engaged. See below for a screen<br />
capture of an antenna that was driven so that the Home Flag switch is engaged.<br />
7.3.6. Open Loop Rate Sensor Monitoring<br />
The DacRemP DISPW graph chart provides a means for monitoring the output of the 3 solid state<br />
rate sensors (located inside the Level Cage Assembly) for diagnostic purposes. The rate sensors are<br />
the primary inputs to the PCU for stabilization.<br />
• To monitor the rate sensors, select the graph chart<br />
• This chart displays sensed output from the 3 rate sensors via three traces, CL (Cross Level),<br />
LV (Elevation), and AZ (Azimuth), at a fixed 1º/Second/vertical division.<br />
• A normal trace display will be ± 1 divisions from the red reference line. The example shown<br />
below shows an antenna that is NOT currently sensing motion in any axis.<br />
• The Cross Level display should decrease (plots below red line) as the antenna is tilted to the<br />
left and increase (plots above red line) as the antenna tilted to the right.<br />
• The Level display should decrease (plots below red line) as the antenna is tilted forward and<br />
increase (plots above red line) as the antenna is tilted back.<br />
• The Azimuth display should decrease (plots below red line) as the antenna is rotated CCW<br />
and increase (plots above red line) as the antenna is rotated CW. In the example below, the<br />
output of the Azimuth rate sensor is plotted above the reference line, indicating that the<br />
antenna was driven CW in Azimuth. Due to the in-practicality of driving an axis at a<br />
7-7

![NC1147 (pdf 1.47 mb) Nitrogen Concentrator [OBIGGS] - Cobham plc](https://img.yumpu.com/51124104/1/190x245/nc1147-pdf-147-mb-nitrogen-concentrator-obiggs-cobham-plc.jpg?quality=85)