

FATE OF MERCURY IN THE ARCTIC Michael Evan ... - COGCI
FATE OF MERCURY IN THE ARCTIC Michael Evan ... - COGCI
FATE OF MERCURY IN THE ARCTIC Michael Evan ... - COGCI

Create successful ePaper yourself
Turn your PDF publications into a flip-book with our unique Google optimized e-Paper software.
F. Roos-Barraclough et al. / The Science of the Total Environment 292 (2002) 129–139<br />
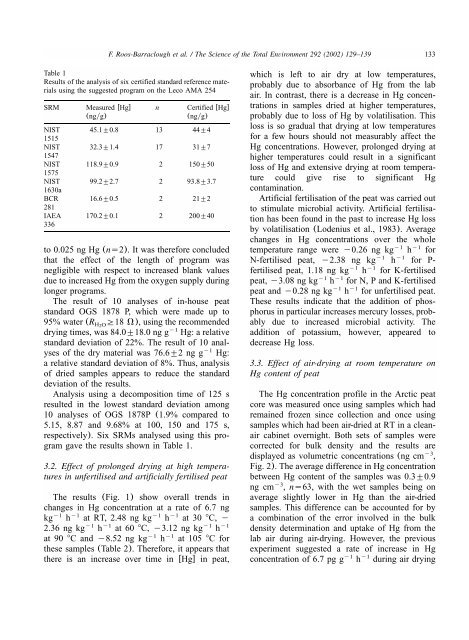
Table 1<br />
Results of the analysis of six certified standard reference materials<br />
using the suggested program on the Leco AMA 254<br />
SRM Measured wHgx n Certified wHgx<br />
(ngyg) (ngyg)<br />
NIST 45.1"0.8 13 44"4<br />
1515<br />
NIST 32.3"1.4 17 31"7<br />
1547<br />
NIST 118.9"0.9 2 150"50<br />
1575<br />
NIST 99.2"2.7 2 93.8"3.7<br />
1630a<br />
BCR 16.6"0.5 2 21"2<br />
281<br />
IAEA 170.2"0.1 2 200"40<br />
336<br />
to 0.025 ng Hg (ns2).It was therefore concluded<br />
that the effect of the length of program was<br />
negligible with respect to increased blank values<br />
due to increased Hg from the oxygen supply during<br />
longer programs.<br />
The result of 10 analyses of in-house peat<br />
standard OGS 1878 P, which were made up to<br />
95% water (RH OG18<br />
V), using the recommended<br />
2<br />
y1<br />
drying times, was 84.0"18.0 ng g Hg: a relative<br />
standard deviation of 22%.The result of 10 anal-<br />
y1<br />
yses of the dry material was 76.6"2 ng g Hg:<br />
a relative standard deviation of 8%.Thus, analysis<br />
of dried samples appears to reduce the standard<br />
deviation of the results.<br />
Analysis using a decomposition time of 125 s<br />
resulted in the lowest standard deviation among<br />
10 analyses of OGS 1878P (1.9% compared to<br />
5.15, 8.87 and 9.68% at 100, 150 and 175 s,<br />
respectively).Six SRMs analysed using this program<br />
gave the results shown in Table 1.<br />
3.2. Effect of prolonged drying at high temperatures<br />
in unfertilised and artificially fertilised peat<br />
The results (Fig.1) show overall trends in<br />
changes in Hg concentration at a rate of 6.7 ng<br />
y1 kg y1 h y1 at RT, 2.48 ng kg y1 h at 30 8C, y<br />
y1 2.36 ng kg y1 h y1 at 60 8C, y3.12 ng kg y1 h<br />
y1 at 90 8C and y8.52 ng kg y1 h at 105 8C for<br />
these samples (Table 2).Therefore, it appears that<br />
there is an increase over time in wHgx in peat,<br />
133<br />
which is left to air dry at low temperatures,<br />
probably due to absorbance of Hg from the lab<br />
air.In contrast, there is a decrease in Hg concentrations<br />
in samples dried at higher temperatures,<br />
probably due to loss of Hg by volatilisation.This<br />
loss is so gradual that drying at low temperatures<br />
for a few hours should not measurably affect the<br />
Hg concentrations.However, prolonged drying at<br />
higher temperatures could result in a significant<br />
loss of Hg and extensive drying at room temperature<br />
could give rise to significant Hg<br />
contamination.<br />
Artificial fertilisation of the peat was carried out<br />
to stimulate microbial activity.Artificial fertilisation<br />
has been found in the past to increase Hg loss<br />
by volatilisation (Lodenius et al., 1983).Average<br />
changes in Hg concentrations over the whole<br />
y1 y1<br />
temperature range were y0.26 ng kg h for<br />
y1 y1<br />
N-fertilised peat, y2.38 ng kg h for P-<br />
y1 y1<br />
fertilised peat, 1.18 ng kg h for K-fertilised<br />
y1 y1<br />
peat, y3.08 ng kg h for N, P and K-fertilised<br />
y1 y1<br />
peat and y0.28 ng kg h for unfertilised peat.<br />
These results indicate that the addition of phosphorus<br />
in particular increases mercury losses, probably<br />
due to increased microbial activity.The<br />
addition of potassium, however, appeared to<br />
decrease Hg loss.<br />
3.3. Effect of air-drying at room temperature on<br />
Hg content of peat<br />
The Hg concentration profile in the Arctic peat<br />
core was measured once using samples which had<br />
remained frozen since collection and once using<br />
samples which had been air-dried at RT in a cleanair<br />
cabinet overnight.Both sets of samples were<br />
corrected for bulk density and the results are<br />
displayed as volumetric concentrations (ng cm , y3<br />
Fig.2).The average difference in Hg concentration<br />
between Hg content of the samples was 0.3"0.9<br />
y3 ng cm , ns63, with the wet samples being on<br />
average slightly lower in Hg than the air-dried<br />
samples.This difference can be accounted for by<br />
a combination of the error involved in the bulk<br />
density determination and uptake of Hg from the<br />
lab air during air-drying.However, the previous<br />
experiment suggested a rate of increase in Hg<br />
y1 y1<br />
concentration of 6.7 pg g h during air drying