

FATE OF MERCURY IN THE ARCTIC Michael Evan ... - COGCI
FATE OF MERCURY IN THE ARCTIC Michael Evan ... - COGCI
FATE OF MERCURY IN THE ARCTIC Michael Evan ... - COGCI

You also want an ePaper? Increase the reach of your titles
YUMPU automatically turns print PDFs into web optimized ePapers that Google loves.
Fate of Mercury in the Arctic 73<br />
4) New Total Volume for each denuder = New count * 10 l per second (fixed)<br />
Control: registered total Volume = Corrected total volume<br />
Control: registered total mass, RGM in ng Hg (0) = new total mass RGM, ng Hg (0).<br />
6) New concentration: New mass / New volume<br />
Run dates and time, reported as Greenwich Mean Time, not local time, in accordance with<br />
the other monitors at CMDL Barrow. The sonic anemometer consistently showed an ambient<br />
temperature of 2 degrees higher than other ambient temperature instruments at CMDL. This<br />
indicates that one ore more of the heads was slightly out of line after shipping. This should not<br />
affect the measurements since the proportionality constant, β, is based on the heat flux, so it is the<br />
difference in temperature that matters. This is assuming, that there was no significant heat flux.<br />
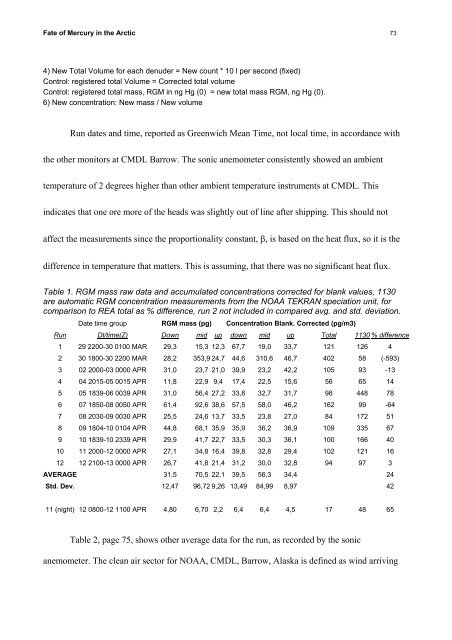
Table 1. RGM mass raw data and accumulated concentrations corrected for blank values, 1130<br />
are automatic RGM concentration measurements from the NOAA TEKRAN speciation unit, for<br />
comparison to REA total as % difference, run 2 not included in compared avg. and std. deviation.<br />
Date time group RGM mass (pg) Concentration Blank. Corrected (pg/m3)<br />
Run Dt/time(Z) Down mid up down mid up Total 1130 % difference<br />
1 29 2200-30 0100 MAR 29,3 15,3 12,3 67,7 19,0 33,7 121 126 4<br />
2 30 1800-30 2200 MAR 28,2 353,9 24,7 44,6 310,6 46,7 402 58 (-593)<br />
3 02 2000-03 0000 APR 31,0 23,7 21,0 39,9 23,2 42,2 105 93 -13<br />
4 04 2015-05 0015 APR 11,8 22,9 9,4 17,4 22,5 15,6 56 65 14<br />
5 05 1839-06 0039 APR 31,0 56,4 27,2 33,8 32,7 31,7 98 448 78<br />
6 07 1850-08 0050 APR 61,4 92,6 38,6 57,5 58,0 46,2 162 99 -64<br />
7 08 2030-09 0030 APR 25,5 24,6 13,7 33,5 23,8 27,0 84 172 51<br />
8 09 1804-10 0104 APR 44,8 68,1 35,9 35,9 36,2 36,9 109 335 67<br />
9 10 1839-10 2339 APR 29,9 41,7 22,7 33,5 30,3 36,1 100 166 40<br />
10 11 2000-12 0000 APR 27,1 34,8 16,4 39,8 32,8 29,4 102 121 16<br />
12 12 2100-13 0000 APR 26,7 41,8 21,4 31,2 30,0 32,8 94 97 3<br />
AVERAGE 31,5 70,5 22,1 39,5 56,3 34,4 24<br />
Std. Dev. 12,47 96,72 9,26 13,49 84,99 8,97 42<br />
11 (night) 12 0800-12 1100 APR 4,80 6,70 2,2 6,4 6,4 4,5 17 48 65<br />
Table 2, page 75, shows other average data for the run, as recorded by the sonic<br />
anemometer. The clean air sector for NOAA, CMDL, Barrow, Alaska is defined as wind arriving