- Page 2:
Adolescent Psychopathologyand the D
- Page 6:
Adolescent Psychopathologyand the D
- Page 10:
PrefaceThis book is the result of a
- Page 14:
ContentsIntroduction 1Daniel Romer
- Page 20:
xContentsAppendix A: Glossary 475Sh
- Page 24:
2 INTRODUCTIONso many of the behavi
- Page 28:
4 INTRODUCTIONoverview of the brain
- Page 32:
This page intentionally left blank
- Page 36:
This page intentionally left blank
- Page 40:
10 BIOLOGICAL AND SOCIAL UNIVERSALS
- Page 44:
12 BIOLOGICAL AND SOCIAL UNIVERSALS
- Page 50:
Adolescent-Typical Behavior Pattern
- Page 54:
Adolescent-Typical Behavior Pattern
- Page 58:
Adolescent-Typical Behavior Pattern
- Page 62:
Adolescent-Typical Behavior Pattern
- Page 66:
Adolescent-Typical Behavior Pattern
- Page 70:
Adolescent-Typical Behavior Pattern
- Page 74:
Adolescent-Typical Behavior Pattern
- Page 78:
Adolescent-Typical Behavior Pattern
- Page 82:
Chapter 2Competence, Resilience, an
- Page 86:
Competence, Resilience, and Develop
- Page 90:
Competence, Resilience, and Develop
- Page 94:
Competence, Resilience, and Develop
- Page 98:
Competence, Resilience, and Develop
- Page 102:
Competence, Resilience, and Develop
- Page 106:
Competence, Resilience, and Develop
- Page 110:
Competence, Resilience, and Develop
- Page 114:
Competence, Resilience, and Develop
- Page 118:
Competence, Resilience, and Develop
- Page 122:
Competence, Resilience, and Develop
- Page 126:
Part IICharacteristics of Brain and
- Page 130:
Chapter 3Mapping Adolescent Brain M
- Page 134:
Mapping Adolescent Brain Change 57p
- Page 138:
Mapping Adolescent Brain Change 59c
- Page 142:
Mapping Adolescent Brain Change 61e
- Page 146:
63Figure 3-3 Top left, three repres
- Page 150:
Mapping Adolescent Brain Change 65F
- Page 154:
Mapping Adolescent Brain Change 67F
- Page 158:
Figure 3-6 This map (left frontal v
- Page 162:
Mapping Adolescent Brain Change 71F
- Page 166:
Figure 3-9 Annualized rate of chang
- Page 170:
75Figure 3-11 Brain-behavior maps f
- Page 174:
Figure 3-12 Gray matter density, gr
- Page 178:
Figure 3-13 A, gray matter group-di
- Page 182:
Mapping Adolescent Brain Change 81
- Page 186:
Mapping Adolescent Brain Change 83I
- Page 190:
Chapter 4The MetamorphosisIndividua
- Page 194:
The Metamorphosis 872003). In commo
- Page 198:
The Metamorphosis 89Infancy was the
- Page 202:
The Metamorphosis 91personal feelin
- Page 206:
The Metamorphosis 93this process ma
- Page 212:
96 CHARACTERISTICS OF BRAIN AND BEH
- Page 216:
98 CHARACTERISTICS OF BRAIN AND BEH
- Page 220:
100 CHARACTERISTICS OF BRAIN AND BE
- Page 224:
102 CHARACTERISTICS OF BRAIN AND BE
- Page 228:
104 CHARACTERISTICS OF BRAIN AND BE
- Page 232:
106 CHARACTERISTICS OF BRAIN AND BE
- Page 236:
108 CHARACTERISTICS OF BRAIN AND BE
- Page 240:
110 CHARACTERISTICS OF BRAIN AND BE
- Page 244:
112 CHARACTERISTICS OF BRAIN AND BE
- Page 248:
114 CHARACTERISTICS OF BRAIN AND BE
- Page 252:
116 CHARACTERISTICS OF BRAIN AND BE
- Page 256:
118 CHARACTERISTICS OF BRAIN AND BE
- Page 260:
120 CHARACTERISTICS OF BRAIN AND BE
- Page 264:
122 CHARACTERISTICS OF BRAIN AND BE
- Page 268:
This page intentionally left blank
- Page 272:
This page intentionally left blank
- Page 276:
128 EFFECTS OF EARLY MALTREATMENT A
- Page 280:
130 EFFECTS OF EARLY MALTREATMENT A
- Page 284:
132 EFFECTS OF EARLY MALTREATMENT A
- Page 288:
134 EFFECTS OF EARLY MALTREATMENT A
- Page 292:
136 EFFECTS OF EARLY MALTREATMENT A
- Page 296:
138 EFFECTS OF EARLY MALTREATMENT A
- Page 300:
140 EFFECTS OF EARLY MALTREATMENT A
- Page 304:
142 EFFECTS OF EARLY MALTREATMENT A
- Page 308:
144 EFFECTS OF EARLY MALTREATMENT A
- Page 312:
146 EFFECTS OF EARLY MALTREATMENT A
- Page 316:
148 EFFECTS OF EARLY MALTREATMENT A
- Page 320:
150 EFFECTS OF EARLY MALTREATMENT A
- Page 324:
152 EFFECTS OF EARLY MALTREATMENT A
- Page 328:
154 EFFECTS OF EARLY MALTREATMENT A
- Page 332:
156 EFFECTS OF EARLY MALTREATMENT A
- Page 336:
158 EFFECTS OF EARLY MALTREATMENT A
- Page 340:
160 EFFECTS OF EARLY MALTREATMENT A
- Page 344:
162 EFFECTS OF EARLY MALTREATMENT A
- Page 348:
164 EFFECTS OF EARLY MALTREATMENT A
- Page 352:
166 EFFECTS OF EARLY MALTREATMENT A
- Page 356:
168 EFFECTS OF EARLY MALTREATMENT A
- Page 360:
170 EFFECTS OF EARLY MALTREATMENT A
- Page 364:
172 EFFECTS OF EARLY MALTREATMENT A
- Page 368:
174 EFFECTS OF EARLY MALTREATMENT A
- Page 372:
176 EFFECTS OF EARLY MALTREATMENT A
- Page 376:
178 EFFECTS OF EARLY MALTREATMENT A
- Page 380:
180 EFFECTS OF EARLY MALTREATMENT A
- Page 384:
182 EFFECTS OF EARLY MALTREATMENT A
- Page 388:
184 EFFECTS OF EARLY MALTREATMENT A
- Page 392:
186 EFFECTS OF EARLY MALTREATMENT A
- Page 396:
188 EFFECTS OF EARLY MALTREATMENT A
- Page 400:
190 EFFECTS OF EARLY MALTREATMENT A
- Page 404:
192 EFFECTS OF EARLY MALTREATMENT A
- Page 408:
194 EFFECTS OF EARLY MALTREATMENT A
- Page 412:
196 EFFECTS OF EARLY MALTREATMENT A
- Page 416:
198 EFFECTS OF EARLY MALTREATMENT A
- Page 420:
200 EFFECTS OF EARLY MALTREATMENT A
- Page 424:
202 EFFECTS OF EARLY MALTREATMENT A
- Page 428:
204 EFFECTS OF EARLY MALTREATMENT A
- Page 432:
206 EFFECTS OF EARLY MALTREATMENT A
- Page 436:
208 EFFECTS OF EARLY MALTREATMENT A
- Page 440:
210 EFFECTS OF EARLY MALTREATMENT A
- Page 444:
212 EFFECTS OF EARLY MALTREATMENT A
- Page 448:
214 EFFECTS OF EARLY MALTREATMENT A
- Page 452:
This page intentionally left blank
- Page 456:
This page intentionally left blank
- Page 460:
220 EFFECTS OF STRESSaimed at ameli
- Page 464:
222 EFFECTS OF STRESSaway from movi
- Page 468:
224 EFFECTS OF STRESSground current
- Page 472:
226 EFFECTS OF STRESSThe second ten
- Page 476:
228 EFFECTS OF STRESSAttention, Emo
- Page 480:
230 EFFECTS OF STRESSprovide an exc
- Page 484:
232 EFFECTS OF STRESSdisorder (De B
- Page 488:
234 EFFECTS OF STRESSExplicit Manip
- Page 492:
236 EFFECTS OF STRESSclarifying the
- Page 496:
238 EFFECTS OF STRESSof all three f
- Page 500:
240 EFFECTS OF STRESSHadwin, J. A.,
- Page 504:
242 EFFECTS OF STRESSNelson, C. A.,
- Page 508:
244 EFFECTS OF STRESSWalter, H., Ab
- Page 512:
246 EFFECTS OF STRESSOne model that
- Page 516:
248 EFFECTS OF STRESScortex will af
- Page 520:
250 EFFECTS OF STRESSof the fibers
- Page 524:
252 EFFECTS OF STRESS2000). It is a
- Page 528:
254 EFFECTS OF STRESSThompson et al
- Page 532:
256 EFFECTS OF STRESSPFCmodulation
- Page 536:
258 EFFECTS OF STRESSHowever, given
- Page 540:
260 EFFECTS OF STRESS& R. H. Dworki
- Page 544:
262 EFFECTS OF STRESSbasolateral am
- Page 548:
264 EFFECTS OF STRESSChapter 12Neur
- Page 552:
266 EFFECTS OF STRESSin primates) f
- Page 556:
268 EFFECTS OF STRESSIn summary, it
- Page 560:
270 EFFECTS OF STRESSevidence of a
- Page 564:
272 EFFECTS OF STRESSinsult, includ
- Page 568:
274 EFFECTS OF STRESSpresumed to be
- Page 572:
276 EFFECTS OF STRESSConclusionsThe
- Page 576:
278 EFFECTS OF STRESSChambers, R. A
- Page 580:
280 EFFECTS OF STRESSLaakmann, G.,
- Page 584:
282 EFFECTS OF STRESSSpear, L. P. (
- Page 588:
284 EFFECTS OF STRESSChapter 13The
- Page 592:
286 EFFECTS OF STRESSMechanisms Und
- Page 596:
288 EFFECTS OF STRESSless. This mod
- Page 600:
290 EFFECTS OF STRESSrumination hyp
- Page 604:
292 EFFECTS OF STRESScontrol” (Pa
- Page 608:
294 EFFECTS OF STRESSin three cross
- Page 612:
296 EFFECTS OF STRESScompetencies (
- Page 616:
298 EFFECTS OF STRESShypothetical t
- Page 620:
300 EFFECTS OF STRESSsuggest that,
- Page 624:
302 EFFECTS OF STRESSis critical to
- Page 628:
304 EFFECTS OF STRESSAlloy, L. B.,
- Page 632:
306 EFFECTS OF STRESSFloyd, T. D.,
- Page 636:
308 EFFECTS OF STRESSdepression in
- Page 640:
310 EFFECTS OF STRESSNolen-Hoeksema
- Page 644:
312 EFFECTS OF STRESSSullivan, M. D
- Page 648:
This page intentionally left blank
- Page 652:
316 REVERSIBLE DISORDERS OF BRAIN D
- Page 656:
318 REVERSIBLE DISORDERS OF BRAIN D
- Page 660:
320 REVERSIBLE DISORDERS OF BRAIN D
- Page 664:
322 REVERSIBLE DISORDERS OF BRAIN D
- Page 668:
324 REVERSIBLE DISORDERS OF BRAIN D
- Page 672:
326 REVERSIBLE DISORDERS OF BRAIN D
- Page 676:
328 REVERSIBLE DISORDERS OF BRAIN D
- Page 680:
330 REVERSIBLE DISORDERS OF BRAIN D
- Page 684:
332 REVERSIBLE DISORDERS OF BRAIN D
- Page 688:
334 REVERSIBLE DISORDERS OF BRAIN D
- Page 692:
336 REVERSIBLE DISORDERS OF BRAIN D
- Page 696:
338 REVERSIBLE DISORDERS OF BRAIN D
- Page 700:
340 REVERSIBLE DISORDERS OF BRAIN D
- Page 704:
342 REVERSIBLE DISORDERS OF BRAIN D
- Page 708:
344 REVERSIBLE DISORDERS OF BRAIN D
- Page 712:
346 REVERSIBLE DISORDERS OF BRAIN D
- Page 716:
348 REVERSIBLE DISORDERS OF BRAIN D
- Page 720:
350 REVERSIBLE DISORDERS OF BRAIN D
- Page 724:
352 REVERSIBLE DISORDERS OF BRAIN D
- Page 728:
354 REVERSIBLE DISORDERS OF BRAIN D
- Page 732:
356 REVERSIBLE DISORDERS OF BRAIN D
- Page 736:
358 REVERSIBLE DISORDERS OF BRAIN D
- Page 740:
360 REVERSIBLE DISORDERS OF BRAIN D
- Page 744:
362 REVERSIBLE DISORDERS OF BRAIN D
- Page 748:
364 REVERSIBLE DISORDERS OF BRAIN D
- Page 752:
366 REVERSIBLE DISORDERS OF BRAIN D
- Page 756:
368 REVERSIBLE DISORDERS OF BRAIN D
- Page 760:
370 REVERSIBLE DISORDERS OF BRAIN D
- Page 764:
372 REVERSIBLE DISORDERS OF BRAIN D
- Page 768:
374 REVERSIBLE DISORDERS OF BRAIN D
- Page 772:
376 REVERSIBLE DISORDERS OF BRAIN D
- Page 776:
378 REVERSIBLE DISORDERS OF BRAIN D
- Page 780: 380 REVERSIBLE DISORDERS OF BRAIN D
- Page 784: 382 REVERSIBLE DISORDERS OF BRAIN D
- Page 788: 384 REVERSIBLE DISORDERS OF BRAIN D
- Page 792: 386 REVERSIBLE DISORDERS OF BRAIN D
- Page 796: 388 REVERSIBLE DISORDERS OF BRAIN D
- Page 800: 390 REVERSIBLE DISORDERS OF BRAIN D
- Page 804: 392 REVERSIBLE DISORDERS OF BRAIN D
- Page 808: 394 REVERSIBLE DISORDERS OF BRAIN D
- Page 812: 396 REVERSIBLE DISORDERS OF BRAIN D
- Page 816: 398 REVERSIBLE DISORDERS OF BRAIN D
- Page 820: This page intentionally left blank
- Page 824: 402 EDUCATIONAL INTERVENTIONScould
- Page 828: 404 EDUCATIONAL INTERVENTIONSFigure
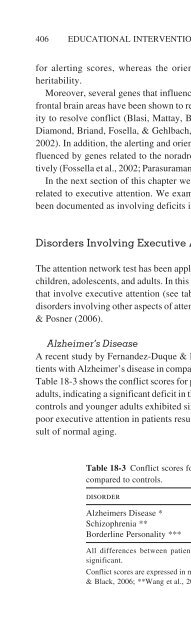
- Page 834: Modifying Brain Networks 407Schizop
- Page 838: Modifying Brain Networks 409sociali
- Page 842: Modifying Brain Networks 411Figure
- Page 846: Modifying Brain Networks 413finding
- Page 850: Modifying Brain Networks 415Not all
- Page 854: Modifying Brain Networks 417This wo
- Page 858: Modifying Brain Networks 419Awh, &
- Page 862: The BrainWise Curriculum 421ents we
- Page 866: The BrainWise Curriculum 423Human S
- Page 870: The BrainWise Curriculum 425nizing
- Page 874: The BrainWise Curriculum 427tive fu
- Page 878: The BrainWise Curriculum 429volves
- Page 882:
The BrainWise Curriculum 431homewor
- Page 886:
The BrainWise Curriculum 433Table 1
- Page 890:
The BrainWise Curriculum 4353.532.5
- Page 894:
The BrainWise Curriculum 437Referen
- Page 898:
The BrainWise Curriculum 439Kusché
- Page 902:
Chapter 20The Role of Preventive In
- Page 906:
The Role of Preventive Intervention
- Page 910:
The Role of Preventive Intervention
- Page 914:
The Role of Preventive Intervention
- Page 918:
The Role of Preventive Intervention
- Page 922:
The Role of Preventive Intervention
- Page 926:
The Role of Preventive Intervention
- Page 930:
The Role of Preventive Intervention
- Page 934:
The Role of Preventive Intervention
- Page 938:
The Role of Preventive Intervention
- Page 942:
The Role of Preventive Intervention
- Page 946:
ConclusionsElaine F. Walker and Dan
- Page 950:
Conclusions 465The above model assu
- Page 954:
Conclusions 467associated with ment
- Page 958:
Conclusions 469female offspring. Th
- Page 962:
Conclusions 471In chapter 18, M. Ro
- Page 966:
Conclusions 473role to play in how
- Page 970:
Appendix AGlossaryShivali DhruvAcet
- Page 974:
Glossary 477pensity to cause extrap
- Page 978:
Glossary 479pulsatile cerebral bloo
- Page 982:
Glossary 481GABA A receptorCNS.A ty
- Page 986:
Glossary 483LTP (long-term potentia
- Page 990:
Glossary 485Noradrenergic transmiss
- Page 994:
Glossary 487fashion. Binding transm
- Page 998:
Glossary 489Typical antipsychotics
- Page 1002:
Brain Locations 491Figure B-2 Horiz
- Page 1006:
Author Biographies 493of the hormon
- Page 1010:
Author Biographies 495Patricia Gorm
- Page 1014:
Author Biographies 497ground influe
- Page 1018:
Author Biographies 499Linda Spear,
- Page 1022:
IndexPage numbers followed by an f
- Page 1026:
Index 503individual differences in,
- Page 1030:
Index 505cortical pattern matching
- Page 1034:
Index 507maternal care effect on, 1
- Page 1038:
Index 509medications. See also spec
- Page 1042:
Index 511dorsomedial (DMPFC), 226f,
- Page 1046:
Index 513prefrontal cortex and, 253