Student Project Abstracts 2005 - Pluto - University of Washington
Student Project Abstracts 2005 - Pluto - University of Washington
Student Project Abstracts 2005 - Pluto - University of Washington

You also want an ePaper? Increase the reach of your titles
YUMPU automatically turns print PDFs into web optimized ePapers that Google loves.
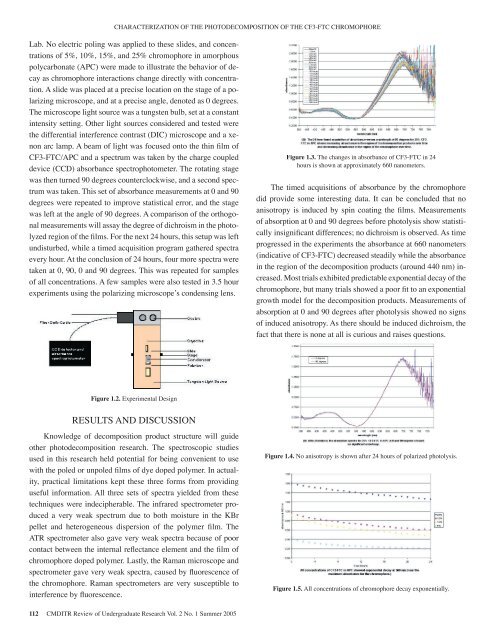
CHARACTERIZATION OF THE PHOTODECOMPOSITION OF THE CF3-FTC CHROMOPHORELab. No electric poling was applied to these slides, and concentrations<strong>of</strong> 5%, 10%, 15%, and 25% chromophore in amorphouspolycarbonate (APC) were made to illustrate the behavior <strong>of</strong> decayas chromophore interactions change directly with concentration.A slide was placed at a precise location on the stage <strong>of</strong> a polarizingmicroscope, and at a precise angle, denoted as 0 degrees.The microscope light source was a tungsten bulb, set at a constantintensity setting. Other light sources considered and tested werethe differential interference contrast (DIC) microscope and a xenonarc lamp. A beam <strong>of</strong> light was focused onto the thin film <strong>of</strong>CF3-FTC/APC and a spectrum was taken by the charge coupleddevice (CCD) absorbance spectrophotometer. The rotating stagewas then turned 90 degrees counterclockwise, and a second spectrumwas taken. This set <strong>of</strong> absorbance measurements at 0 and 90degrees were repeated to improve statistical error, and the stagewas left at the angle <strong>of</strong> 90 degrees. A comparison <strong>of</strong> the orthogonalmeasurements will assay the degree <strong>of</strong> dichroism in the photolyzedregion <strong>of</strong> the films. For the next 24 hours, this setup was leftundisturbed, while a timed acquisition program gathered spectraevery hour. At the conclusion <strong>of</strong> 24 hours, four more spectra weretaken at 0, 90, 0 and 90 degrees. This was repeated for samples<strong>of</strong> all concentrations. A few samples were also tested in 3.5 hourexperiments using the polarizing microscope’s condensing lens.Figure 1.3. The changes in absorbance <strong>of</strong> CF3-FTC in 24hours is shown at approximately 660 nanometers.The timed acquisitions <strong>of</strong> absorbance by the chromophoredid provide some interesting data. It can be concluded that noanisotropy is induced by spin coating the films. Measurements<strong>of</strong> absorption at 0 and 90 degrees before photolysis show statisticallyinsignificant differences; no dichroism is observed. As timeprogressed in the experiments the absorbance at 660 nanometers(indicative <strong>of</strong> CF3-FTC) decreased steadily while the absorbancein the region <strong>of</strong> the decomposition products (around 440 nm) increased.Most trials exhibited predictable exponential decay <strong>of</strong> thechromophore, but many trials showed a poor fit to an exponentialgrowth model for the decomposition products. Measurements <strong>of</strong>absorption at 0 and 90 degrees after photolysis showed no signs<strong>of</strong> induced anisotropy. As there should be induced dichroism, thefact that there is none at all is curious and raises questions.Figure 1.2. Experimental DesignRESULTS AND DISCUSSIONKnowledge <strong>of</strong> decomposition product structure will guideother photodecomposition research. The spectroscopic studiesused in this research held potential for being convenient to usewith the poled or unpoled films <strong>of</strong> dye doped polymer. In actuality,practical limitations kept these three forms from providinguseful information. All three sets <strong>of</strong> spectra yielded from thesetechniques were indecipherable. The infrared spectrometer produceda very weak spectrum due to both moisture in the KBrpellet and heterogeneous dispersion <strong>of</strong> the polymer film. TheATR spectrometer also gave very weak spectra because <strong>of</strong> poorcontact between the internal reflectance element and the film <strong>of</strong>chromophore doped polymer. Lastly, the Raman microscope andspectrometer gave very weak spectra, caused by fluorescence <strong>of</strong>the chromophore. Raman spectrometers are very susceptible tointerference by fluorescence.Figure 1.4. No anisotropy is shown after 24 hours <strong>of</strong> polarized photolysis.Figure 1.5. All concentrations <strong>of</strong> chromophore decay exponentially.112 CMDITR Review <strong>of</strong> Undergraduate Research Vol. 2 No. 1 Summer <strong>2005</strong>