Transmission electron microscopy has been used to investigatethe effects <strong>of</strong> digestive ripening. Figure (a) and (b) shows and cyclohexane showing nanoparticles slightly narrower were combined plasmon bands with than varioustwo distinct sets <strong>of</strong> Thin absorption Film spectra, Composites: with particles Ag in 3:1 toluene (OT:DT)Au nanoparticles before and after digestive ripening, respectively. particles in dichlorobenzene polymers and to dichloromethane.cast nanocomposite films. Beforecasting the films the solutions were filtered usingBefore digestive ripening, the average size <strong>of</strong> the particles wasa 0.2µm filter.7.1±5nm, which is a much larger size range compared to 4.9±0.8nm Thin Film Compositesfor particles after digestive ripening. Figure (c) and (d) shows Ag Ag 3:1 (OT:DT) nanoparticles were combined with various3:1 (OT:DT) nanoparticles before and after digestive ripening, respectively.on glass Before substrates. digestive ripening The the particles were 4.6±1.5nm the solutions were filtered using a 0.2µm filter.paration: All <strong>of</strong> the films investigatedpolymers to cast nanocomposite films. Before casting the filmseparedosite films in size. consisting After digestive <strong>of</strong> Au ripening or Ag the particles were slightly smaller A red shift <strong>of</strong> surface plasmon resonance is seen showing ales mixed and with more various uniform polymers with an average (PS = size <strong>of</strong> 4.0±1.2nm.maximum absorption peak around 500nm (Graph d) compared toe, PMMA = poly (methylte), PVKAbsorption= poly (vinylspectracarbozole)),in the UV-visible range were measured on silver nanoparticles in solutions, which show a maximum absorptionpeak around 420nm. Since polystyrene showed the largestcast at 1000rpm Au (DT) for nanoparticles 2 minutes before using and a after digestive ripening, in ased solution. toluene solution. Before digestive ripening the spectrum shows a red shift and was the most readily available, it was used for all <strong>of</strong>broader absorption peak with a higher baseline (Graph a) than the the subsequent nanocomposite Graph (d) film – Absorption preparations. spectra <strong>of</strong> Ag 3:1 (OT:DT)S cles were The maximum <strong>of</strong> the absorption spectrum wasnanoparticle filmsated. solution Au after digestive shifted ripening. from 500nm in solution to 545nm in A similar red shift <strong>of</strong> surface plasmon resonance with respectabsorption Ripening: Ag nanoparticles polystyrene were not films. soluble after Films digestive with ripening higher and weight to solution measurements A red shift was <strong>of</strong> also surface seen for plasmon Au (DT) resonance nanoparticlesin polystyrene showing (Graph e) a (filtered maximum with absorption .1µm filter). peak aroundis seenene andabsorption spectrum ratios <strong>of</strong> in nanoparticles solution could not exhibited be measured. larger red shiftsGraph (a) – UV-vis <strong>of</strong> Au nanoparticler plasmon <strong>of</strong> the plasmon band (570nm).500nm (Graph d) compared to silverThe maximum <strong>of</strong> the absorption spectrum was shifted fromzene and An investigation <strong>of</strong> ligand effect onnanoparticles in solutions, which show aNanoparticle SolutionsAg nanoparticles were not 500nm soluble in after solution digestivenanocomposite films was also conducted. Thinmaximum to 545nm absorption in polystyrene peak films. around Films 420nm. with SinceAn investigation <strong>of</strong> solvent effects wasripeningconductedand anonabsorptionAu higherspectrumweightinratiossolutionfilms <strong>of</strong> Ag 3:1 (OT:DT) <strong>of</strong> nanoparticles exhibited larger shifts <strong>of</strong>couldnanoparticlesnot be measured.(filteredpolystyrene showed the largest red and was(OT:DT) (DT) and Ag 3:1 with (OT:DT) 0.45µm nanoparticles. filters) and Ag 1:1 (OT:DT) the plasmon band (570nm).the most readily available, it was used for all <strong>of</strong>the subsequent nanocomposite film preparations.various UV-vis spectroscopy nanoparticles was performed (filtered Nanoparticle on with the 0.2µm various Solutions: solutions(Graph bfilters) in An An investigation <strong>of</strong> <strong>of</strong> A ligand similar effect red on nanocomposite shift <strong>of</strong> surface films was plasmons. Before polystyreneand c). The absorptionwere preparedspectra solvent <strong>of</strong> Agwith effects nanoparticlesvarious was conducted weightalso conducted. Au (DT) Thin resonance and films <strong>of</strong> Ag with 3:1 respect (OT:DT) to solution nanoparticles measurements (filteredwith 0.45µm filters) was also and Ag seen 1:1 for (OT:DT) Au (DT) nanoparticles nanoparticles (fil- intered using ratios, (Graph f and Ag g3:1 nanoparticle (OT:DT) nanoparticles. ratioswere similar in all solvents investigated. Au nanoparticles hadAu before Figure (b) decreased – Au after by for each solution).polystyrene (Graph e) (filtered with .1µm filter).Graph (a) – UV-vis <strong>of</strong> Au nanoparticleAg nanoparticles were not soluble after digestiveripening and an absorption spectrum in solutioncould not be measured.Ag before Figure (d) – Ag afterionNanoparticleelectron microscopySolutions:has beenAnusedinvestigation <strong>of</strong>solvent Graph effects (a) was – UV-vis conducted <strong>of</strong> Au nanoparticle on Au (DT) andgateOT:DT)the effects Graph <strong>of</strong> (a) digestive - UV-vis <strong>of</strong> Au ripening. nanoparticleGraph (b) - Absorption spectra <strong>of</strong> Ag 3:1 (OT:DT) Graph (e) – Absorption spectra <strong>of</strong> Au (DT) nanoparticles inGraph (b) - Absorption spectra <strong>of</strong> AgGraph (c) - Absorption spectra <strong>of</strong> AuAg 3:1 (OT:DT) nanoparticles.nanoparticles in solutionpolystyrene films. The Au nanoparticle amount was) and (b) shows Au nanoparticles3:1 (OT:DT) nanoparticles in solution(DT) nanoparticles in solutiond Ag after nanoparticles digestive ripening, were not respectively. soluble after digestivea 0.2µmdecreasedfilter.by in every film (top to bottom).estive ce ripening is seen ripening, and an the absorption average size spectrum <strong>of</strong> the in solutionak could as around 7.1±5nm, not be measured. which is a Graph much (g) larger – Absorption spectra <strong>of</strong> Ag 1:1 (OT:DT)to compared silver to 4.9±0.8nm nanoparticle for particles films in polystyrene. The weight ratio <strong>of</strong>tive Nanoparticle show ripening. a Figure Solutions: (c) nanoparticles and (d) An shows investigation was decreased by <strong>of</strong> for every sample fromnm. T:DT) solvent Since nanoparticles effects was before conducted and after on Au sample (DT) 1 to and sample 4.ripening, ft Ag and 3:1 was (OT:DT) respectively. nanoparticles. Before digestivethe for particles all <strong>of</strong> were 4.6±1.5nm In both cases in size. a blue shift in the absorption peakparations. estive ripening the was particles observed were when the nanoparticlemaller plasmon and more uniform concentration with an was lowered. The Ag 1:1 spectrumze surements <strong>of</strong> 4.0±1.2nm. also shows a shoulder around 400nm.tion spectra in the UV-visible rangearticles insured on Au (DT) nanoparticles beforem filter). CONCLUSIONdigestive Graph (b) ripening, - Absorption in spectra a toluene <strong>of</strong> Ag 3:1 (OT:DT) Graph (c)- Absorption spectra <strong>of</strong> Au (DT) nanoparticles inGraph nanoparticles (d) – Completing Absorption solution spectra the <strong>of</strong> Ag digestive ripening Graph (e) process – Absorption Graph (d) – (OT:DT)Before digestive ripening the spectrumsolutionunder spectra <strong>of</strong> Au (DT)Graph (f) - Absorption spectra <strong>of</strong> Ag 3:1 3:1 (OT:DT) an argon nanoparticle flow filmsshows many improvements nanoparticles in polystyrene to the films. TheDT) nanoparticle nanoparticle films in polystyrene. films Theroader absorption peak with a higherAu nanoparticle amount was decreasedweight ratio <strong>of</strong> nanoparticles was decreased by(Graph a) than the Au solution nanoparticles. after These UV-vis improvements spectroscopy include was a performed on theby ½ in every film (top to bottom).½ for every sample from sample 1 to sample 4.ripening. more uniform size and better various solubility solutions <strong>of</strong> (Graph the Au b and c). The32 CMDITR Review <strong>of</strong> Undergraduate Research Vol. 2 No. 1 Summer <strong>2005</strong>Graph (b) - Absorption spectra <strong>of</strong> Ag 3:1 (OT:DT)spectra, with particles in toluene andcyclohexane showing slightly narrower plasmonbands than particles in dichlorobenzene andOPTICAL PROPERTIES OF METAL NANOPARTICLE COMPOSITS dichloromethane.Graph (f) – Absorption spectra <strong>of</strong> Ag 3:1 (OT:DT)nanoparticle films in polystyrene. The weight ratio <strong>of</strong>nanoparticles was decreased by for every sample fromsample 1 to sample 4.nanoparticles. The effect <strong>of</strong> digestive ripening onAg 3:1 (OT:DT) nanoparticles was not asbeneficial. After digestive ripening, the Agnanoparticles were no longer soluble and only aabsorption spectra <strong>of</strong> Ag nanoparticles weresimilar in all solvents investigated. Aunanoparticles had two distinct sets <strong>of</strong> absorptionspectra, with particles in toluene andcyclohexane showing slightly narrower plasmonbands than particles in dichlorobenzene anddichloromethane.Thin Film Composites: Ag 3:1 (OT:DT)nanoparticles were combined with variouspolymers to cast nanocomposite films. Beforecasting the films the solutions were filtered usingA red shift <strong>of</strong> surface plasmon resonance is seenshowing a maximum absorption peak around500nm (Graph d) compared to silvernanoparticles in solutions, which show amaximum absorption peak around 420nm. Since
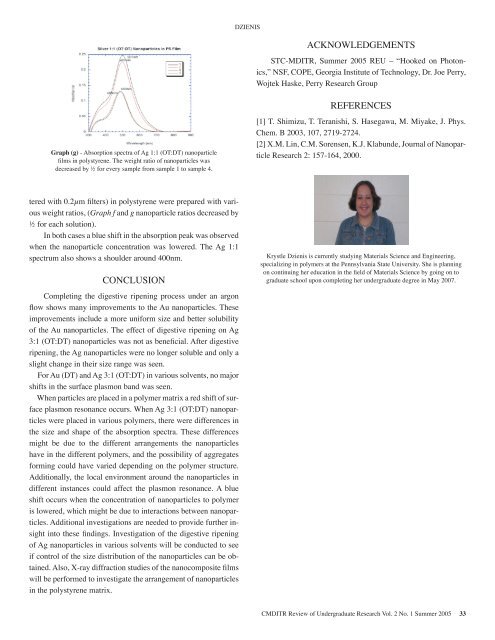
DZIENISACKNOWLEDGEMENTSSTC-MDITR, Summer <strong>2005</strong> REU – “Hooked on Photonics,”NSF, COPE, Georgia Institute <strong>of</strong> Technology, Dr. Joe Perry,Wojtek Haske, Perry Research GroupGraph (g) - Absorption spectra <strong>of</strong> Ag 1:1 (OT:DT) nanoparticlefilms in polystyrene. The weight ratio <strong>of</strong> nanoparticles wasdecreased by ½ for every sample from sample 1 to sample 4.REFERENCES[1] T. Shimizu, T. Teranishi, S. Hasegawa, M. Miyake, J. Phys.Chem. B 2003, 107, 2719-2724.[2] X.M. Lin, C.M. Sorensen, K.J. Klabunde, Journal <strong>of</strong> NanoparticleResearch 2: 157-164, 2000.tered with 0.2µm filters) in polystyrene were prepared with variousweight ratios, (Graph f and g nanoparticle ratios decreased by½ for each solution).In both cases a blue shift in the absorption peak was observedwhen the nanoparticle concentration was lowered. The Ag 1:1spectrum also shows a shoulder around 400nm.CONCLUSIONCompleting the digestive ripening process under an argonflow shows many improvements to the Au nanoparticles. Theseimprovements include a more uniform size and better solubility<strong>of</strong> the Au nanoparticles. The effect <strong>of</strong> digestive ripening on Ag3:1 (OT:DT) nanoparticles was not as beneficial. After digestiveripening, the Ag nanoparticles were no longer soluble and only aslight change in their size range was seen.For Au (DT) and Ag 3:1 (OT:DT) in various solvents, no majorshifts in the surface plasmon band was seen.When particles are placed in a polymer matrix a red shift <strong>of</strong> surfaceplasmon resonance occurs. When Ag 3:1 (OT:DT) nanoparticleswere placed in various polymers, there were differences inthe size and shape <strong>of</strong> the absorption spectra. These differencesmight be due to the different arrangements the nanoparticleshave in the different polymers, and the possibility <strong>of</strong> aggregatesforming could have varied depending on the polymer structure.Additionally, the local environment around the nanoparticles indifferent instances could affect the plasmon resonance. A blueshift occurs when the concentration <strong>of</strong> nanoparticles to polymeris lowered, which might be due to interactions between nanoparticles.Additional investigations are needed to provide further insightinto these findings. Investigation <strong>of</strong> the digestive ripening<strong>of</strong> Ag nanoparticles in various solvents will be conducted to seeif control <strong>of</strong> the size distribution <strong>of</strong> the nanoparticles can be obtained.Also, X-ray diffraction studies <strong>of</strong> the nanocomposite filmswill be performed to investigate the arrangement <strong>of</strong> nanoparticlesin the polystyrene matrix.Krystle Dzienis is currently studying Materials Science and Engineering,specializing in polymers at the Pennsylvania State <strong>University</strong>. She is planningon continuing her education in the field <strong>of</strong> Materials Science by going on tograduate school upon completing her undergraduate degree in May 2007.CMDITR Review <strong>of</strong> Undergraduate Research Vol. 2 No. 1 Summer <strong>2005</strong> 33
- Page 2 and 3: The material is based upon work sup
- Page 4 and 5: TABLE OF CONTENTSSynthesis of Dendr
- Page 6 and 7: 6 CMDITR Review of Undergraduate Re
- Page 8 and 9: SYNTHESIS OF DENDRIMER BUILDING BLO
- Page 10 and 11: throughout the work period. Five su
- Page 12 and 13: 12 CMDITR Review of Undergraduate R
- Page 14 and 15: BARIUM TITANATE DOPED SOL-GEL FOR E
- Page 16 and 17: BARIUM TITANATE DOPED SOL-GEL FOR E
- Page 18 and 19: SYNTHESIS OF NORBORNENE MONOMER OF
- Page 20: 20 CMDITR Review of Undergraduate R
- Page 23 and 24: using different reaction conditions
- Page 25 and 26: Synthesis of Nonlinear Optical-Acti
- Page 27 and 28: quality of the XRD structures wasca
- Page 29 and 30: Behavioral Properties of Colloidal
- Page 34 and 35: 34 CMDITR Review of Undergraduate R
- Page 36 and 37: areorient themselves with the elect
- Page 38 and 39: Fabry-Perot modulators with electro
- Page 40 and 41: 40 CMDITR Review of Undergraduate R
- Page 42 and 43: QUANTIZED HAMILTON DYNAMICS APPLIED
- Page 44 and 45: 44 CMDITR Review of Undergraduate R
- Page 46 and 47: INVESTIGATING NEW CLADDING AND CORE
- Page 48 and 49: Dr. Robert NorwoodChris DeRoseAmir
- Page 50 and 51: SYNTHESIS OF TPD-BASED COMPOUNDS FO
- Page 52 and 53: SYNTHESIS OF TPD-BASED COMPOUNDS FO
- Page 54 and 55: OPTIMIZING HYBRID WAVEGUIDESpropaga
- Page 56 and 57: At closer spaces the second undesir
- Page 58 and 59: SYNTHESIS AND ANALYSIS OF THIOL-STA
- Page 60 and 61: 60 CMDITR Review of Undergraduate R
- Page 62 and 63: QUINOXALINE-CONTAINING POLYFLUORENE
- Page 64 and 65: QUINOXALINE-CONTAINING POLYFLUORENE
- Page 66 and 67: 66 CMDITR Review of Undergraduate R
- Page 68 and 69: SYNTHESIS OF DENDRON-FUNCTIONALIZED
- Page 70 and 71: 70 CMDITR Review of Undergraduate R
- Page 72 and 73: BUILDING AN OPTICAL OXIMETER TO MEA
- Page 74 and 75: 74 CMDITR Review of Undergraduate R
- Page 76 and 77: 76 CMDITR Review of Undergraduate R
- Page 78 and 79: TOWARD MOLECULAR RESOLUTION C-AFM W
- Page 80 and 81: TOWARD MOLECULAR RESOLUTION C-AFM W
- Page 82 and 83:
SYNTHESIS AND CHARACTERIZATION OF E
- Page 84 and 85:
My name is Aaron Montgomery and I a
- Page 86 and 87:
1,1-DIPHENYL-2,3,4,5-TETRAKIS(9,9-D
- Page 88 and 89:
1,1-DIPHENYL-2,3,4,5-TETRAKIS(9,9-D
- Page 90 and 91:
EFFECTS OF SURFACE CHEMISTRY ON CAD
- Page 92 and 93:
EFFECTS OF SURFACE CHEMISTRY ON CAD
- Page 94 and 95:
94 CMDITR Review of Undergraduate R
- Page 96 and 97:
SYNTHESIS OF A POLYENE EO CHROMOPHO
- Page 98 and 99:
SYNTHESIS OF A POLYENE EO CHROMOPHO
- Page 102 and 103:
102 CMDITR Review of Undergraduate
- Page 104 and 105:
CHARACTERIZATION OF THE MOLECULAR P
- Page 106 and 107:
106 CMDITR Review of Undergraduate
- Page 108 and 109:
OPTIMIZATION OF SEMICONDUCTOR NANOP
- Page 110 and 111:
OPTIMIZATION OF SEMICONDUCTOR NANOP
- Page 112 and 113:
CHARACTERIZATION OF THE PHOTODECOMP
- Page 114 and 115:
114 CMDITR Review of Undergraduate
- Page 116 and 117:
ELECTROLUMINESCENT PROPERTIES OF OR
- Page 118 and 119:
118 CMDITR Review of Undergraduate
- Page 120 and 121:
DETERMINATION OF MOLECULAR ORIENTAT
- Page 122 and 123:
DETERMINATION OF MOLECULAR ORIENTAT
- Page 124 and 125:
HYDROGEL MATERIALS FOR TWO-PHOTON M
- Page 126 and 127:
HYDROGEL MATERIALS FOR TWO-PHOTON M
- Page 128 and 129:
THE DESIGN OF A FLUID DELIVERY SYST
- Page 130:
THE DESIGN OF A FLUID DELIVERY SYST