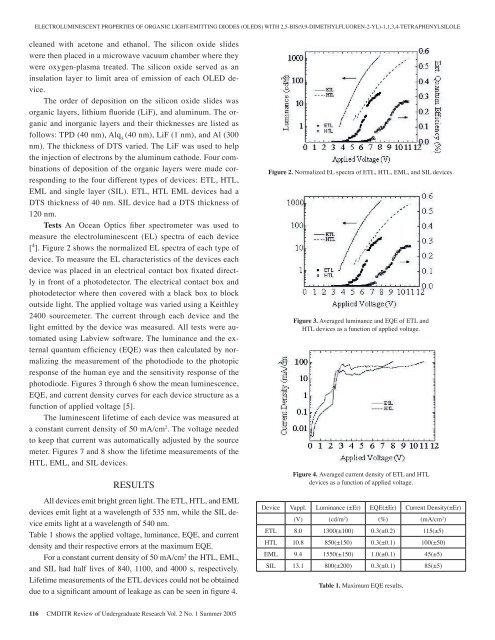
ELECTROLUMINESCENT PROPERTIES OF ORGANIC LIGHT-EMITTING DIODES (OLEDS) WITH 2,5-BIS(9,9-DIMETHYLFLUOREN-2-YL)-1,1,3,4-TETRAPHENYLSILOLEcleaned with acetone and ethanol. The silicon oxide slideswere then placed in a microwave vacuum chamber where theywere oxygen-plasma treated. The silicon oxide served as aninsulation layer to limit area <strong>of</strong> emission <strong>of</strong> each OLED device.The order <strong>of</strong> deposition on the silicon oxide slides wasorganic layers, lithium fluoride (LiF), and aluminum. The organicand inorganic layers and their thicknesses are listed asfollows: TPD (40 nm), Alq 3(40 nm), LiF (1 nm), and Al (300nm). The thickness <strong>of</strong> DTS varied. The LiF was used to helpthe injection <strong>of</strong> electrons by the aluminum cathode. Four combinations<strong>of</strong> deposition <strong>of</strong> the organic layers were made correspondingto the four different types <strong>of</strong> devices: ETL, HTL,EML and single layer (SIL). ETL, HTL EML devices had aDTS thickness <strong>of</strong> 40 nm. SIL device had a DTS thickness <strong>of</strong>120 nm.Tests An Ocean Optics fiber spectrometer was used tomeasure the electroluminescent (EL) spectra <strong>of</strong> each device[ 4 ]. Figure 2 shows the normalized EL spectra <strong>of</strong> each type <strong>of</strong>device. To measure the EL characteristics <strong>of</strong> the devices eachdevice was placed in an electrical contact box fixated directlyin front <strong>of</strong> a photodetector. The electrical contact box andphotodetector where then covered with a black box to blockoutside light. The applied voltage was varied using a Keithley2400 sourcemeter. The current through each device and thelight emitted by the device was measured. All tests were automatedusing Labview s<strong>of</strong>tware. The luminance and the externalquantum efficiency (EQE) was then calculated by normalizingthe measurement <strong>of</strong> the photodiode to the photopicresponse <strong>of</strong> the human eye and the sensitivity response <strong>of</strong> thephotodiode. Figures 3 through 6 show the mean luminescence,EQE, and current density curves for each device structure as afunction <strong>of</strong> applied voltage [5].The luminescent lifetime <strong>of</strong> each device was measured ata constant current density <strong>of</strong> 50 mA/cm 2 . The voltage neededto keep that current was automatically adjusted by the sourcemeter. Figures 7 and 8 show the lifetime measurements <strong>of</strong> theHTL, EML, and SIL devices.RESULTSAll devices emit bright green light. The ETL, HTL, and EMLdevices emit light at a wavelength <strong>of</strong> 535 nm, while the SIL deviceemits light at a wavelength <strong>of</strong> 540 nm.Table 1 shows the applied voltage, luminance, EQE, and currentdensity and their respective errors at the maximum EQE.For a constant current density <strong>of</strong> 50 mA/cm 2 the HTL, EML,and SIL had half lives <strong>of</strong> 840, 1100, and 4000 s, respectively.Lifetime measurements <strong>of</strong> the ETL devices could not be obtaineddue to a significant amount <strong>of</strong> leakage as can be seen in figure 4.Figure 2. Normalized EL spectra <strong>of</strong> ETL, HTL, EML, and SIL devices.Figure 3. Averaged luminance and EQE <strong>of</strong> ETL andHTL devices as a function <strong>of</strong> applied voltage.Figure 4. Averaged current density <strong>of</strong> ETL and HTLdevices as a function <strong>of</strong> applied voltage.Device Vappl. Luminance (±Er) EQE(±Er) Current Density(±Er)(V) (cd/m 2 ) (%) (mA/cm 2 )ETL 8.0 1300(±100) 0.3(±0.2) 115(±5)HTL 10.8 850(±150) 0.3(±0.1) 100(±50)EML 9.4 1550(±150) 1.0(±0.1) 45(±5)SIL 13.1 800(±200) 0.3(±0.1) 85(±5)Table 1. Maximum EQE results.116 CMDITR Review <strong>of</strong> Undergraduate Research Vol. 2 No. 1 Summer <strong>2005</strong>
Figure 5. Averaged luminance and EQE <strong>of</strong> EML andSIL devices as a function <strong>of</strong> applied voltage.Figure 6. Averaged current density <strong>of</strong> EML and SILdevices as a function <strong>of</strong> applied voltage.Ext. Quantum Efficiency (%)THOMPSONCONCLUSIONThe ETL devices do not appear to operate significantly betterthan the HTL devices. The ETL devices do have a lower turnon voltage but the current densities are very similar. The nearlyhorizontal shape <strong>of</strong> the current density plot shows there is currentleakage. DTS appears to be ambipolar meaning it can be used totransport both holes and electrons.ACKNOWLEDGEMENTSThis work was supported by the MDITR, a Science andTechnology Center <strong>of</strong> the National Science Foundation (NSF)under Agreement Number DMR-0120967.REFERENCES[] Chen, H. Y.; Lam, W. Y.; Luo, J. D.; Tang, B. Z.; Zhu, D. B.;Wong, A.; Kwok, H. S. App. Phys. Let. 2002, 81, 574-576.[ 2 ] Lee, J.; Liu, Q.; Bai, D.; Kang, Y.; T, Y.; W, S. Organometallics.2004, 23, 6205-6208.[ 3 ] Murata, H.; Kafafi, Z. H.; Uchida, M. App. Phys. Let. 2002,80, 189-191.[ 4 ] Dini, D. Chem. Mater. <strong>2005</strong>, 17, 1933-1944.[ 5 ] Forrest, S. R.; Bradley, D. D. C.; Thompson, M. E. Adv. Mater.2003, 13, 1043-1048.Evans Thompson is currently studying mechanical engineering at GeorgiaInstitute <strong>of</strong> Technology. Evans intends to obtain a master’s degree inmechanical engineering upon graduating from Georgia Tech.Figure 7. Luminance <strong>of</strong> HTL and EML devices as a function <strong>of</strong> time.Figure 8. Luminance <strong>of</strong> SIL device as a function <strong>of</strong> time.CMDITR Review <strong>of</strong> Undergraduate Research Vol. 2 No. 1 Summer <strong>2005</strong> 117
- Page 2 and 3:
The material is based upon work sup
- Page 4 and 5:
TABLE OF CONTENTSSynthesis of Dendr
- Page 6 and 7:
6 CMDITR Review of Undergraduate Re
- Page 8 and 9:
SYNTHESIS OF DENDRIMER BUILDING BLO
- Page 10 and 11:
throughout the work period. Five su
- Page 12 and 13:
12 CMDITR Review of Undergraduate R
- Page 14 and 15:
BARIUM TITANATE DOPED SOL-GEL FOR E
- Page 16 and 17:
BARIUM TITANATE DOPED SOL-GEL FOR E
- Page 18 and 19:
SYNTHESIS OF NORBORNENE MONOMER OF
- Page 20:
20 CMDITR Review of Undergraduate R
- Page 23 and 24:
using different reaction conditions
- Page 25 and 26:
Synthesis of Nonlinear Optical-Acti
- Page 27 and 28:
quality of the XRD structures wasca
- Page 29 and 30:
Behavioral Properties of Colloidal
- Page 32 and 33:
Transmission electron microscopy ha
- Page 34 and 35:
34 CMDITR Review of Undergraduate R
- Page 36 and 37:
areorient themselves with the elect
- Page 38 and 39:
Fabry-Perot modulators with electro
- Page 40 and 41:
40 CMDITR Review of Undergraduate R
- Page 42 and 43:
QUANTIZED HAMILTON DYNAMICS APPLIED
- Page 44 and 45:
44 CMDITR Review of Undergraduate R
- Page 46 and 47:
INVESTIGATING NEW CLADDING AND CORE
- Page 48 and 49:
Dr. Robert NorwoodChris DeRoseAmir
- Page 50 and 51:
SYNTHESIS OF TPD-BASED COMPOUNDS FO
- Page 52 and 53:
SYNTHESIS OF TPD-BASED COMPOUNDS FO
- Page 54 and 55:
OPTIMIZING HYBRID WAVEGUIDESpropaga
- Page 56 and 57:
At closer spaces the second undesir
- Page 58 and 59:
SYNTHESIS AND ANALYSIS OF THIOL-STA
- Page 60 and 61:
60 CMDITR Review of Undergraduate R
- Page 62 and 63:
QUINOXALINE-CONTAINING POLYFLUORENE
- Page 64 and 65:
QUINOXALINE-CONTAINING POLYFLUORENE
- Page 66 and 67: 66 CMDITR Review of Undergraduate R
- Page 68 and 69: SYNTHESIS OF DENDRON-FUNCTIONALIZED
- Page 70 and 71: 70 CMDITR Review of Undergraduate R
- Page 72 and 73: BUILDING AN OPTICAL OXIMETER TO MEA
- Page 74 and 75: 74 CMDITR Review of Undergraduate R
- Page 76 and 77: 76 CMDITR Review of Undergraduate R
- Page 78 and 79: TOWARD MOLECULAR RESOLUTION C-AFM W
- Page 80 and 81: TOWARD MOLECULAR RESOLUTION C-AFM W
- Page 82 and 83: SYNTHESIS AND CHARACTERIZATION OF E
- Page 84 and 85: My name is Aaron Montgomery and I a
- Page 86 and 87: 1,1-DIPHENYL-2,3,4,5-TETRAKIS(9,9-D
- Page 88 and 89: 1,1-DIPHENYL-2,3,4,5-TETRAKIS(9,9-D
- Page 90 and 91: EFFECTS OF SURFACE CHEMISTRY ON CAD
- Page 92 and 93: EFFECTS OF SURFACE CHEMISTRY ON CAD
- Page 94 and 95: 94 CMDITR Review of Undergraduate R
- Page 96 and 97: SYNTHESIS OF A POLYENE EO CHROMOPHO
- Page 98 and 99: SYNTHESIS OF A POLYENE EO CHROMOPHO
- Page 102 and 103: 102 CMDITR Review of Undergraduate
- Page 104 and 105: CHARACTERIZATION OF THE MOLECULAR P
- Page 106 and 107: 106 CMDITR Review of Undergraduate
- Page 108 and 109: OPTIMIZATION OF SEMICONDUCTOR NANOP
- Page 110 and 111: OPTIMIZATION OF SEMICONDUCTOR NANOP
- Page 112 and 113: CHARACTERIZATION OF THE PHOTODECOMP
- Page 114 and 115: 114 CMDITR Review of Undergraduate
- Page 118 and 119: 118 CMDITR Review of Undergraduate
- Page 120 and 121: DETERMINATION OF MOLECULAR ORIENTAT
- Page 122 and 123: DETERMINATION OF MOLECULAR ORIENTAT
- Page 124 and 125: HYDROGEL MATERIALS FOR TWO-PHOTON M
- Page 126 and 127: HYDROGEL MATERIALS FOR TWO-PHOTON M
- Page 128 and 129: THE DESIGN OF A FLUID DELIVERY SYST
- Page 130: THE DESIGN OF A FLUID DELIVERY SYST


