Student Project Abstracts 2005 - Pluto - University of Washington
Student Project Abstracts 2005 - Pluto - University of Washington
Student Project Abstracts 2005 - Pluto - University of Washington

Create successful ePaper yourself
Turn your PDF publications into a flip-book with our unique Google optimized e-Paper software.
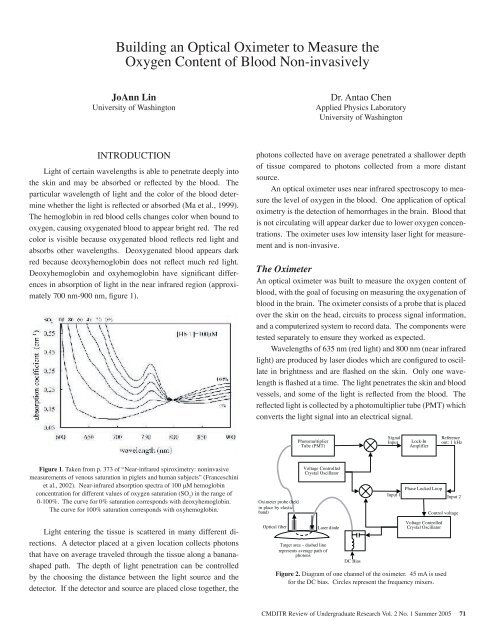
Building an Optical Oximeter to Measure theOxygen Content <strong>of</strong> Blood Non-invasivelyJoAnn Lin<strong>University</strong> <strong>of</strong> <strong>Washington</strong>Dr. Antao ChenApplied Physics Laboratory<strong>University</strong> <strong>of</strong> <strong>Washington</strong>INTRODUCTIONLight <strong>of</strong> certain wavelengths is able to penetrate deeply intothe skin and may be absorbed or reflected by the blood. Theparticular wavelength <strong>of</strong> light and the color <strong>of</strong> the blood determinewhether the light is reflected or absorbed (Ma et al., 1999).The hemoglobin in red blood cells changes color when bound tooxygen, causing oxygenated blood to appear bright red. The redcolor is visible because oxygenated blood reflects red light andabsorbs other wavelengths. Deoxygenated blood appears darkred because deoxyhemoglobin does not reflect much red light.Deoxyhemoglobin and oxyhemoglobin have significant differencesin absorption <strong>of</strong> light in the near infrared region (approximately700 nm-900 nm, figure 1).photons collected have on average penetrated a shallower depth<strong>of</strong> tissue compared to photons collected from a more distantsource.An optical oximeter uses near infrared spectroscopy to measurethe level <strong>of</strong> oxygen in the blood. One application <strong>of</strong> opticaloximetry is the detection <strong>of</strong> hemorrhages in the brain. Blood thatis not circulating will appear darker due to lower oxygen concentrations.The oximeter uses low intensity laser light for measurementand is non-invasive.The OximeterAn optical oximeter was built to measure the oxygen content <strong>of</strong>blood, with the goal <strong>of</strong> focusing on measuring the oxygenation <strong>of</strong>blood in the brain. The oximeter consists <strong>of</strong> a probe that is placedover the skin on the head, circuits to process signal information,and a computerized system to record data. The components weretested separately to ensure they worked as expected.Wavelengths <strong>of</strong> 635 nm (red light) and 800 nm (near infraredlight) are produced by laser diodes which are configured to oscillatein brightness and are flashed on the skin. Only one wavelengthis flashed at a time. The light penetrates the skin and bloodvessels, and some <strong>of</strong> the light is reflected from the blood. Thereflected light is collected by a photomultiplier tube (PMT) whichconverts the light signal into an electrical signal.PhotomultiplierTube (PMT)SignalInputLock-InAmplifierReferenceout: 1 kHzFigure 1. Taken from p. 373 <strong>of</strong> “Near-infrared spiroximetry: noninvasivemeasurements <strong>of</strong> venous saturation in piglets and human subjects” (Franceschiniet al., 2002). Near-infrared absorption spectra <strong>of</strong> 100 μM hemoglobinconcentration for different values <strong>of</strong> oxygen saturation (SO 2) in the range <strong>of</strong>0-100%. The curve for 0% saturation corresponds with deoxyhemoglobin.The curve for 100% saturation corresponds with oxyhemoglobin.Light entering the tissue is scattered in many different directions.A detector placed at a given location collects photonsthat have on average traveled through the tissue along a bananashapedpath. The depth <strong>of</strong> light penetration can be controlledby the choosing the distance between the light source and thedetector. If the detector and source are placed close together, theOximeter probe (heldin place by elasticband)Optical fiberVoltage ControlledCrystal OscillatorLaser diodeTarget area – dashed linerepresents average path <strong>of</strong>photonsDC BiasFigure 2. Diagram <strong>of</strong> one channel <strong>of</strong> the oximeter. 45 mA is usedfor the DC bias. Circles represent the frequency mixers.Figure 2. Diagram <strong>of</strong> one channel <strong>of</strong> the oximeter. 45 mA is used for the DC bias. Circles represent the frequency mixers.The laser light is intensity modulated to allow themeasurement <strong>of</strong> intensity as well as phase shift.From this information the absorption and scatteringmay be determined (Hueber et al., 2001). Typicallyfrequencies around 100 MHz or higher have been usedCMDITR Review <strong>of</strong> Undergraduate Research Vol. 2 No. 1 Summer <strong>2005</strong> 71in other oximeters (Franceschini et al., 2002; Ma etal., 1999). The modulation for the oximeter waschosen to be 54 MHz because the laser diodes hadhigher intensities at this frequency than at the otherfrequency choice <strong>of</strong> 100 MHz (figure 4). The setup infigure 3 was used to test the frequency rangeavailable.Input 1Phase Locked LoopVoltage ControlledCrystal OscillatorInput 2Control voltageOscilloscopeCh2 Ch1