Student Project Abstracts 2005 - Pluto - University of Washington
Student Project Abstracts 2005 - Pluto - University of Washington
Student Project Abstracts 2005 - Pluto - University of Washington

Create successful ePaper yourself
Turn your PDF publications into a flip-book with our unique Google optimized e-Paper software.
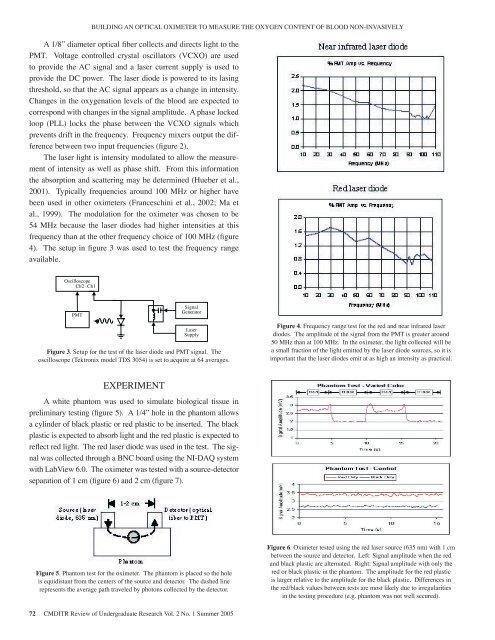
BUILDING AN OPTICAL OXIMETER TO MEASURE THE OXYGEN CONTENT OF BLOOD NON-INVASIVELYA 1/8” diameter optical fiber collects and directs light to thePMT. Voltage controlled crystal oscillators (VCXO) are usedto provide the AC signal and a laser current supply is used toSignalprovide the DC power. Photomultiplier The laser diode is poweredInputto its Lock-In lasingTube (PMT)Amplifierthreshold, so that the AC signal appears as a change in intensity.Changes in the oxygenation levels <strong>of</strong> the blood are expected toVoltage Controlledcorrespond with changes Crystal in the Oscillator signal amplitude. A phase lockedloop (PLL) locks the phase between the VCXO signals whichprevents drift in the frequency. Frequency mixers Input output 1 the differencebetween two input frequencies (figure 2).Oximeter probe (heldin place by elasticband)The laser light is intensity modulated to allow the measurement<strong>of</strong> intensity Optical fiber as well asLaserphasediodeshift. From this informationthe absorption and scattering may be determined (Hueber et al.,2001). TypicallyTargetfrequenciesarea – dashed linearound 100 MHz or higher haverepresents average path <strong>of</strong>been used in other oximetersphotons(Franceschini et al., 2002; Ma etDC Biasal., 1999). The modulation for the oximeter was chosen to be54 MHz because the laser diodes had higher intensities at thisThe laser light is intensity modulated to allow the al., 1999).frequency than at the other frequency choice <strong>of</strong> 100 MHz (figureFigure 2. Diagram <strong>of</strong> one channel <strong>of</strong> the oximeter. 45 mA is used for the DC bias. Circles represent the frequency mixers.measurement <strong>of</strong> intensity as well as phase shift.From this information the absorption and scattering4). The setup figure 3 was used to test the frequency rangemay be determined (Hueber et al., 2001). Typicallyavailable.frequencies around 100 MHz or higher have been usedin other oximeters (Franceschini et al., 2002; Ma etPhase Locked LoopVoltage ControlledCrystal OscillatorReferenceout: 1 kHzInput 2Control voltageThe modulation for the oximeter waschosen to be 54 MHz because the laser diodes hadhigher intensities at this frequency than at the otherfrequency choice <strong>of</strong> 100 MHz (figure 4). The setup infigure 3 was used to test the frequency rangeavailable.OscilloscopeCh2 Ch1PMTSignalGeneratorFigure 3. Setup for the test <strong>of</strong> thelaser diode and PMT signal. Theoscilloscope (Tektronix model TDS3054) is set to acquire at 64averages.Figure 4. Frequency range test for the red and near infrared laserLaserFigure 4. Frequency Near range infrareddiodes. test for laserThediodeSupplyamplitude <strong>of</strong> the signal from the PMT is greater aroundthe red and near infrared laserdiodes. The amplitude % PMT <strong>of</strong> the Amp 50 signal MHz vs. Freque than at 100 MHz. In the oximeter, the light collected will befrom the PMT is greater around 50 MHz than at 100 MHz. In the oximeter, the light collected will be a small fractionFigure 3. Setup for the test <strong>of</strong> the laser diode and PMT signal. Thea small <strong>of</strong> the2.5fraction <strong>of</strong> the light emitted by the laser diode sources, so it islight emitted by the laser diode sources, so it is important that the laser diodes emit at as high an intensity as practical.oscilloscope (Tektronix model TDS 3054) is set to acquire at 64 averages.important that the laser diodes emit at as high an intensity as practical.2.0Experimenttissue in preliminary testing (figure 5). A 1/4” holeA white phantom was used to simulate biological1.5in the phantom allows a cylinder <strong>of</strong> black plastic orred plastic to be inserted. 1.0 The black plastic isEXPERIMENT expected to absorb light and the red plastic is expected1-2 cmto reflect red light. The 0.5 red laser diode was used inSource (laserDetector (opticaldiode, 635 nm)fiber to PMT)0.0A white phantom was used to simulate biological tissue in10 20 30 40 50 60 70 80 90 100preliminary testing (figure 5). A 1/4” hole in the phantom allowsa cylinder <strong>of</strong> black plastic or red plastic to be inserted. The blackPhantomplastic is expected to absorb light and the red plastic is expected toreflect red light. The red laser diode was used in the test. The signalwas collected through a BNC board using the NI-DAQ systemwith LabView 6.0. The oximeter was tested with a source-detectorseparation <strong>of</strong> 1 cm (figure 6) and 2 cm (figure 7).Frequency (MHPMT Amp/Ref Amp (%)Figure 5. Phantom test for the oximeter. The phantom is placed so the holeis equidistant from the centers <strong>of</strong> the source and detector. The dashed linerepresents the average path traveled by photons collected by the detector.Figure 6. Oximeter tested using the red laser source (635 nm) with 1 cmbetween the source and detector. Left: Signal amplitude when the redand black plastic are alternated. Right: Signal amplitude with only thered or black plastic in the phantom. The amplitude for the red plasticis larger relative to the amplitude for the black plastic. Differences inthe red/black values between tests are most likely due to irregularitiesin the testing procedure (e.g. phantom was not well secured).72 CMDITR Review <strong>of</strong> Undergraduate Research Vol. 2 No. 1 Summer <strong>2005</strong>