- Page 1 and 2:
WISE USEOF MIRES AND PEATLANDS -BAC
- Page 3 and 4:
IMCG/IPS STATEMENT3CONTENTSGuide to
- Page 5 and 6:
IMCG/IPS STATEMENT5References .....
- Page 7 and 8:
IMCG/IPS STATEMENT7Peatlands are na
- Page 9 and 10:
IMCG/IPS STATEMENT9use of the peatl
- Page 11 and 12:
GUIDE TO THE USE OF THE DOCUMENT11a
- Page 13 and 14:
GUIDE TO THE USE OF THE DOCUMENT13A
- Page 15 and 16:
GUIDE TO THE USE OF THE DOCUMENT15b
- Page 17 and 18:
GUIDE TO THE USE OF THE DOCUMENT17c
- Page 19 and 20:
INTRODUCTION19resources. These help
- Page 21 and 22:
INTRODUCTION211998 Peatlands Under
- Page 23 and 24:
INTRODUCTION23●●●●●●●
- Page 25 and 26:
MIRES AND PEATLANDS252.2 PEAT FORMA
- Page 27 and 28:
MIRES AND PEATLANDS27Table 2/1: Eco
- Page 29 and 30:
MIRES AND PEATLANDS29Figure 2/3: Hy
- Page 31 and 32:
MIRES AND PEATLANDS31peat formation
- Page 33 and 34:
MIRES AND PEATLANDS33Outside the tr
- Page 35 and 36:
MIRES AND PEATLANDS35decay in the c
- Page 37 and 38:
MIRES AND PEATLANDS37formed peat an
- Page 39 and 40:
MIRES AND PEATLANDS39
- Page 41 and 42:
MIRES AND PEATLANDS41differs in thi
- Page 43 and 44:
MIRES AND PEATLANDS43Sieffermann et
- Page 45 and 46:
VALUES AND FUCTIONS OF MIRES AND PE
- Page 47 and 48:
VALUES AND FUCTIONS OF MIRES AND PE
- Page 49 and 50:
VALUES AND FUCTIONS OF MIRES AND PE
- Page 51 and 52:
VALUES AND FUCTIONS OF MIRES AND PE
- Page 53 and 54:
VALUES AND FUCTIONS OF MIRES AND PE
- Page 55 and 56:
VALUES AND FUCTIONS OF MIRES AND PE
- Page 57 and 58:
VALUES AND FUCTIONS OF MIRES AND PE
- Page 59 and 60:
VALUES AND FUCTIONS OF MIRES AND PE
- Page 61 and 62:
VALUES AND FUCTIONS OF MIRES AND PE
- Page 63 and 64:
VALUES AND FUCTIONS OF MIRES AND PE
- Page 65 and 66:
VALUES AND FUCTIONS OF MIRES AND PE
- Page 67 and 68:
VALUES AND FUCTIONS OF MIRES AND PE
- Page 69 and 70:
VALUES AND FUCTIONS OF MIRES AND PE
- Page 71 and 72:
VALUES AND FUCTIONS OF MIRES AND PE
- Page 73 and 74:
VALUES AND FUCTIONS OF MIRES AND PE
- Page 75 and 76:
VALUES AND FUCTIONS OF MIRES AND PE
- Page 77 and 78:
VALUES AND FUCTIONS OF MIRES AND PE
- Page 79 and 80:
VALUES AND FUCTIONS OF MIRES AND PE
- Page 81 and 82:
VALUES AND FUCTIONS OF MIRES AND PE
- Page 83 and 84:
VALUES AND FUCTIONS OF MIRES AND PE
- Page 85 and 86:
VALUES AND FUCTIONS OF MIRES AND PE
- Page 87 and 88:
VALUES AND FUCTIONS OF MIRES AND PE
- Page 89 and 90:
VALUES AND FUCTIONS OF MIRES AND PE
- Page 91 and 92:
VALUES AND FUCTIONS OF MIRES AND PE
- Page 93 and 94:
VALUES AND FUCTIONS OF MIRES AND PE
- Page 95 and 96:
VALUES AND FUCTIONS OF MIRES AND PE
- Page 97 and 98:
VALUES AND FUCTIONS OF MIRES AND PE
- Page 99 and 100:
VALUES AND FUCTIONS OF MIRES AND PE
- Page 101 and 102:
VALUES AND CONFLICTS: WHERE DIFFERE
- Page 103 and 104:
VALUES AND CONFLICTS: WHERE DIFFERE
- Page 105 and 106:
VALUES AND CONFLICTS: WHERE DIFFERE
- Page 107 and 108:
VALUES AND CONFLICTS: WHERE DIFFERE
- Page 109 and 110:
VALUES AND CONFLICTS: WHERE DIFFERE
- Page 111 and 112:
VALUES AND CONFLICTS: WHERE DIFFERE
- Page 113 and 114:
VALUES AND CONFLICTS: WHERE DIFFERE
- Page 115 and 116:
VALUES AND CONFLICTS: WHERE DIFFERE
- Page 117 and 118:
VALUES AND CONFLICTS: WHERE DIFFERE
- Page 119 and 120:
VALUES AND CONFLICTS: WHERE DIFFERE
- Page 121 and 122:
FRAMEWORK FOR WISE USE121This consi
- Page 123 and 124:
FRAMEWORK FOR WISE USE123Some examp
- Page 125 and 126:
FRAMEWORK FOR WISE USE1253. There i
- Page 127 and 128:
FRAMEWORK FOR WISE USE1278. The pri
- Page 129 and 130:
FRAMEWORK FOR WISE USE129(2) Intern
- Page 131 and 132:
FRAMEWORK FOR WISE USE131National p
- Page 133 and 134:
FRAMEWORK FOR WISE USE133(8) Educat
- Page 135 and 136:
FRAMEWORK FOR WISE USE135the manage
- Page 137 and 138:
FRAMEWORK FOR WISE USE137Does the e
- Page 139 and 140:
FRAMEWORK FOR WISE USE139well-being
- Page 141 and 142:
FRAMEWORK FOR WISE USE141This summa
- Page 143 and 144: FRAMEWORK FOR WISE USE143knowledge
- Page 145 and 146: FRAMEWORK FOR WISE USE145Surwold Me
- Page 147 and 148: FRAMEWORK FOR WISE USE147Peatland-l
- Page 149 and 150: FRAMEWORK FOR WISE USE149Marine tra
- Page 151 and 152: FRAMEWORK FOR WISE USE151Bog prepar
- Page 153 and 154: FRAMEWORK FOR WISE USE153Peat-fired
- Page 155 and 156: FRAMEWORK FOR WISE USE155Cattle on
- Page 157 and 158: FRAMEWORK FOR WISE USE157Pristine p
- Page 159 and 160: FRAMEWORK FOR WISE USE159Fire on a
- Page 161 and 162: FRAMEWORK FOR WISE USE16171See §§
- Page 163 and 164: GLOSSARY OF CONCEPTS AND TERMS163Ba
- Page 165 and 166: GLOSSARY OF CONCEPTS AND TERMS165De
- Page 167 and 168: GLOSSARY OF CONCEPTS AND TERMS167Fo
- Page 169 and 170: GLOSSARY OF CONCEPTS AND TERMS169In
- Page 171 and 172: GLOSSARY OF CONCEPTS AND TERMS171No
- Page 173 and 174: GLOSSARY OF CONCEPTS AND TERMS173Pi
- Page 175 and 176: GLOSSARY OF CONCEPTS AND TERMS175So
- Page 177 and 178: GLOSSARY OF CONCEPTS AND TERMS177Vo
- Page 179 and 180: ACKNOWLEDGEMENTS179Lindsay, Richard
- Page 181 and 182: ACKNOWLEDGEMENTS181International Pe
- Page 183 and 184: APPENDICES183APPENDICES
- Page 185 and 186: APPENDIX I185Original 2002 2002Coun
- Page 187 and 188: APPENDIX I187Philippines 300,000 10
- Page 189 and 190: APPENDIX I189Country Total area Pea
- Page 191 and 192: APPENDIX I191Country Total area Pea
- Page 193: APPENDIX I193The other important as
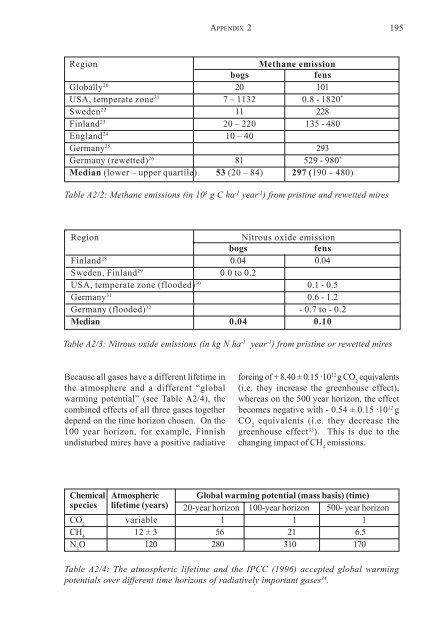
- Page 197 and 198: APPENDIX 2197A2.3 THE ROLE OF PEATL
- Page 199 and 200: APPENDIX 21991200010000FensBogskg C
- Page 201 and 202: APPENDIX 2201Total C in 10 9 gUndis
- Page 203 and 204: APPENDIX 2203source of carbon dioxi
- Page 205 and 206: APPENDIX 4205APPENDIX 4PATTERNS OF
- Page 207 and 208: APPENDIX 4207license from the relev
- Page 209 and 210: APPENDIX 52093. Quality of decision
- Page 211 and 212: APPENDIX 6211APPENDIX 6CODE OF COND
- Page 213 and 214: APPENDIX 7213APPENDIX 7INTERNATIONA
- Page 215 and 216: APPENDICES2151Based on information
- Page 217 and 218: REFERENCES217REFERENCESAardema, M.,
- Page 219 and 220: REFERENCES219Bedford, B.L., 1999, C
- Page 221 and 222: REFERENCES221morning. Hunting and n
- Page 223 and 224: REFERENCES223Application of static
- Page 225 and 226: REFERENCES225Amsterdam, pp. 35-65.F
- Page 227 and 228: REFERENCES227beautiful). Proceeding
- Page 229 and 230: REFERENCES229595 p.IPCC, 1995, Clim
- Page 231 and 232: REFERENCES231der Sitten (Ed. by Kra
- Page 233 and 234: REFERENCES233are you harvested. Rev
- Page 235 and 236: REFERENCES235Marschner, H., 1995, M
- Page 237 and 238: REFERENCES237wet relationship. Tran
- Page 239 and 240: REFERENCES239Växtsociologiska Säl
- Page 241 and 242: REFERENCES241Peatland, Sarawak, Mal
- Page 243 and 244: REFERENCES243Schäfer, A., and Dege
- Page 245 and 246:
REFERENCES245Sirin, A.A., Minaeva T
- Page 247 and 248:
REFERENCES247Princeton University P
- Page 249 and 250:
REFERENCES249Kluwer Academic Publis
- Page 251 and 252:
REFERENCES251Event, p. 222.Whinam,
- Page 253 and 254:
INDEX253INDEXAAapa mire 30, 42, 81,
- Page 255 and 256:
INDEX255Arrhenius Svante 99Art/arti
- Page 257 and 258:
INDEX257Black peat 41, 54, 56, 58,
- Page 259 and 260:
INDEX259Carex canescens 27Carex ces
- Page 261 and 262:
INDEX261Cloud condensation nuclei 7
- Page 263 and 264:
INDEX263Cross purposes 103Cross-cou
- Page 265 and 266:
INDEX265Dutch Foundation for the Co
- Page 267 and 268:
INDEX267Eurasia 60, 75, 196Europe 3
- Page 269 and 270:
INDEX269Freedom from arbitrary arre
- Page 271 and 272:
INDEX271Growing media 51-53, 136, 1
- Page 273 and 274:
INDEX273Hydrologic characteristics
- Page 275 and 276:
INDEX275ISO 14001 136Isotope 169Iso
- Page 277 and 278:
INDEX277Lathyrus palustris 27Latk F
- Page 279 and 280:
INDEX279Management Guidelines 19, 2
- Page 281 and 282:
REFERENCES281Modifiers 120, 127-128
- Page 283 and 284:
REFERENCES283New Caledonia 191New Z
- Page 285 and 286:
REFERENCES285PPacific North West 71
- Page 287 and 288:
REFERENCES287Photochemically active
- Page 289 and 290:
REFERENCES289Product diversificatio
- Page 291 and 292:
REFERENCES291Research 100Research n
- Page 293 and 294:
REFERENCES293Scotland 58, 59, 98Sco
- Page 295 and 296:
REFERENCES295Song of the Peatbog So
- Page 297 and 298:
REFERENCES297Suspended solids 56, 8
- Page 299 and 300:
REFERENCES299Triglochin palustre 27
- Page 301 and 302:
REFERENCES301Verlandungsmoore 26Ver
- Page 303 and 304:
REFERENCES303Wool 57Works of art 83