- Page 4:
TRTRTR
- Page 7 and 8:
KOMSYON TARAFINDAN AVRUPA PARLAMENT
- Page 9 and 10:
ülkelerindeki muadilleriyle uzmanl
- Page 11 and 12:
Anlamasna Ek Protokol’ü tam olar
- Page 13 and 14:
deiikliklerinin kabulü olumlu bir
- Page 15 and 16:
strateji gelitirmemitir; Hükümeti
- Page 17 and 18:
mücadele konusunda AB müktesebatn
- Page 19 and 20:
düzeyde ise, Türkiye’yi yapsal
- Page 21 and 22:
TRTRTR
- Page 23 and 24:
ÇNDEKLER1. GR ....................
- Page 25 and 26:
KOMSYON ÇALIMA DOKÜMANITÜRKYE 20
- Page 27 and 28:
AB, ubat 2008’de kabul edilen Kat
- Page 29 and 30:
toplu sözleme hakk getirmekte ve k
- Page 31 and 32:
effafln, hesap verebilirliin ve kat
- Page 33 and 34:
Kanunu’nda deiiklik yaplmamtr. Mi
- Page 35 and 36:
Erzincan Cumhuriyet Basavcsnn örg
- Page 37 and 38:
Almanya’da açlan dolandrclk dava
- Page 39 and 40:
Kolluk Gözetim Komisyonu kurulmasn
- Page 41 and 42:
Sonuç olarak, cezaevi reform progr
- Page 43 and 44:
Pembe Üçgen LGBTT Dernei hakknda
- Page 45 and 46:
Yargtay, Temmuz 2007’de, Patrikha
- Page 47 and 48:
konu basnda tartlmtr. Sistemin effa
- Page 49 and 50:
Ancak, yaklak 200.000 çocuk - öze
- Page 51 and 52:
eksiklii yeni mevzuatn benimsenmesi
- Page 53 and 54:
Ancak, Türkiye’nin aznlk haklarn
- Page 55 and 56:
aynda, Bat’daki illerden Manisa
- Page 57 and 58:
2010 yl Mart aynda, iltica ilemleri
- Page 59 and 60:
konusunda mutabakata varmlardr. Bil
- Page 61 and 62:
2009 ylnda yllk enflasyon oran % 6,
- Page 63 and 64:
iletmeyi kapatmak ortalama 3,3 yl g
- Page 65 and 66:
iken, Aralk 2009’da % 21,4’e d
- Page 67 and 68:
konularnda yeni ve deiiklik getiren
- Page 69 and 70:
ithalat ve ihracat lisans uygulamal
- Page 71 and 72:
Mali Eylem Görev Gücü (FATF), on
- Page 73 and 74:
SPK, effafl artrmak amacyla, birlem
- Page 75 and 76:
SonuçGenel olarak, uygulama hâlâ
- Page 77 and 78:
prospektüs gereklilikleri konusund
- Page 79 and 80:
önemli bir aama olan Tarm ve Köyi
- Page 81 and 82:
devam etmitir. Bata ap ve bulac sü
- Page 83 and 84:
yönelik çok yll iyiletirme plan k
- Page 85 and 86:
da son urad liman Güney Kbrs Rum Y
- Page 87 and 88:
tüketim vergilerine ilikin baz ile
- Page 89 and 90:
4.18. Fasl 18: statistikstatistiki
- Page 91 and 92:
sürdürmütür. Aktif istihdam ted
- Page 93 and 94:
müktesebatnn etkili bir biçimde u
- Page 95 and 96:
IPA uygulamas kapsamnda yer alan me
- Page 97 and 98:
Yargnn etkinliiyle ilgili olarak, y
- Page 99 and 100:
Saytay’n güçlendirilmesini ve y
- Page 101 and 102:
suçlarn yetikinlerle beraber ilenm
- Page 103 and 104:
AB ve Türkiye arasnda bir geri kab
- Page 105 and 106:
yönetiminin hazrlanmas için tedbi
- Page 107 and 108:
Türk kolluk kuvvetleri tarafndan,
- Page 109 and 110:
Teknolojisi Plan’na (SET Plan) or
- Page 111 and 112:
koordinasyonu artrmak ve AB müktes
- Page 113 and 114:
güvenliini ve kalitesini artrmak v
- Page 115 and 116:
geçmeye yönelik çabalarn hzlandr
- Page 117 and 118:
Orta Dou konusunda, Türkiye, özel
- Page 119 and 120:
Avronun sahtecilie kar korunmas kon
- Page 121 and 122:
Ödemeler dengesi Not 2000 2001 200
- Page 123 and 124:
Altyap Not 2000 2001 2002 2003 2004
- Page 129:
ENENEN
- Page 132 and 133:
EUROPEAN COMMISSIONBrussels, 9.11.2
- Page 134 and 135:
Enlargement needs to remain credibl
- Page 136 and 137:
4. PROGRESS IN THE ENLARGEMENT COUN
- Page 138 and 139:
ANNEX 2Conclusions of the Progress
- Page 140 and 141:
The legal framework guaranteeing wo
- Page 142 and 143:
enefits from previous years of fisc
- Page 144 and 145:
party to international conventions.
- Page 146 and 147:
in free circulation in the EU to su
- Page 148 and 149:
EUROPEAN COMMISSIONBrussels, 9 Nove
- Page 150 and 151:
4.18. Chapter 18: Statistics.......
- Page 152 and 153:
1.3. Relations between the EU and T
- Page 154 and 155:
y lack of dialogue and spirit of co
- Page 156 and 157:
immunities when crimes against the
- Page 158 and 159:
serve as secretariat for the Counte
- Page 160 and 161:
handling of the case to date, has r
- Page 162 and 163:
institutions, labour unions and the
- Page 164 and 165:
2010 on the Demopoulos v. Turkey ca
- Page 166 and 167:
scheme from June 2009 to March 2010
- Page 168 and 169:
In October, the Court of Cassation
- Page 170 and 171:
circular include protecting and mai
- Page 172 and 173:
established, so that all non-Muslim
- Page 174 and 175:
8) rose for both boys and girls, vi
- Page 176 and 177:
accessibility and the related natio
- Page 178 and 179:
For 943 applications the Foundation
- Page 180 and 181:
The amended Law on fundamental prin
- Page 182 and 183:
A large number of executives and po
- Page 184 and 185:
In addition, Turkey has not made pr
- Page 186 and 187:
in the first half of 2009, economic
- Page 188 and 189:
accountability, efficiency and tran
- Page 190 and 191:
the sharp drop in real interest rat
- Page 192 and 193:
assessment covers progress achieved
- Page 194 and 195:
everages remain burdensome. The Tob
- Page 196 and 197:
on nurses. The regulation laying do
- Page 198 and 199: positive step to enhance integrity
- Page 200 and 201: laws regulating industrial design a
- Page 202 and 203: made in the area of State aid. A St
- Page 204 and 205: As regards audiovisual policy, the
- Page 206 and 207: 2006 and endorsed by the European C
- Page 208 and 209: Progress in the area of seed and pr
- Page 210 and 211: The DGCA extended the scope of the
- Page 212 and 213: Good progress can be reported in th
- Page 214 and 215: duty on alcoholic beverages contrad
- Page 216 and 217: accidents occurred in 2008, slightl
- Page 218 and 219: dispersed and weak. Further efforts
- Page 220 and 221: 4.21. Chapter 21: Trans-European ne
- Page 222 and 223: 4.23. Chapter 23: Judiciary and fun
- Page 224 and 225: An action plan, with timetables for
- Page 226 and 227: As regards treatment of socially vu
- Page 228 and 229: e given an opportunity to contact t
- Page 230 and 231: stage. The finalization of a roadma
- Page 232 and 233: During the reporting period no sign
- Page 234 and 235: 4.25. Chapter 25: Science and resea
- Page 236 and 237: in the European Cultural Heritage D
- Page 238 and 239: levels were put in place. No progre
- Page 240 and 241: public health, there has been good
- Page 242 and 243: export controls for conventional ar
- Page 244 and 245: ConclusionTurkey’s alignment with
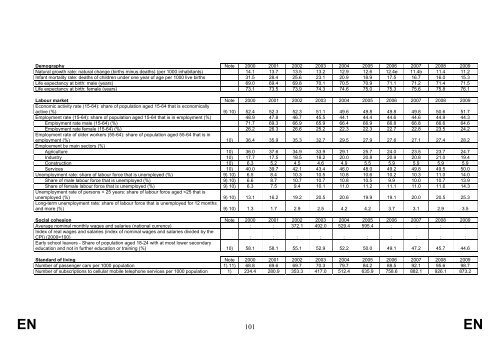
- Page 246 and 247: STATISTICAL DATA (as of 14 October
- Page 250: 1) Mid-year population estimates2)


