- Page 1 and 2:
Town of SummervilleComprehensive Pl
- Page 3 and 4:
Town of SummervilleComprehensive Pl
- Page 5 and 6:
Table of ContentsIV.Population Elem
- Page 7 and 8:
Table of ContentsTable CF8: Private
- Page 9 and 10:
I. Future Land Use Element
- Page 11 and 12:
Future Land Use ElementGoals and Ob
- Page 13 and 14:
The NMU District promotes neighborh
- Page 16 and 17:
Goal Two - Future Land Use Corridor
- Page 19 and 20:
Future Land Use Element ‐ Impleme
- Page 21 and 22:
DistrictsLand UsesResidences(Reside
- Page 23 and 24:
Strategy Two: Future Land Use Corri
- Page 25 and 26:
Strategy Three: Future Land Use Foc
- Page 27 and 28:
!"a$Mallard RdJedburg Rdtu 78Deming
- Page 29 and 30:
Francis Beidler ForestDorangeI-26CO
- Page 31 and 32:
Figure TD1: Level of ServiceSource:
- Page 33 and 34:
The AvenueCross-section 2-laneAvenu
- Page 35 and 36:
The ThoroughfareThoroughfares shoul
- Page 37 and 38:
Goal Three - Transportation System
- Page 39 and 40:
2 ‐ Local Streets, interconnectiv
- Page 41 and 42:
3.1 - Complete Berlin G. Myers Park
- Page 43 and 44:
information on ridership projection
- Page 45 and 46:
Jedburg Rd!"a$Old Dairy RdMallard R
- Page 47 and 48:
III.Priority Investment Element
- Page 49 and 50:
Coordination of Goals and Objective
- Page 51 and 52:
The Fifth Street North corridor is
- Page 53 and 54:
Local governments in South Carolina
- Page 55 and 56:
and ride facilities for express bus
- Page 57 and 58:
Jedburg Rd!"a$Mallard Rdtu 78Deming
- Page 59 and 60:
Population ElementPopulation Trends
- Page 61 and 62:
Household CharacteristicsAt the tim
- Page 63 and 64:
The poverty line or threshold is de
- Page 65 and 66:
Demographic CharacteristicsFigure P
- Page 67 and 68:
V. Natural Resources Element
- Page 69 and 70:
subsurface flow to surface runoff,
- Page 71 and 72: Figure NR1: An Example of a Rain Ga
- Page 73 and 74: Table NR2 : Endangered Plant and An
- Page 75 and 76: Table NR3: Partial Listing of Invas
- Page 77 and 78: considered for protection, either t
- Page 79 and 80: STRATEGY PARTNERS IMPLEMENTATIONTOO
- Page 81 and 82: The WaterRivers and their adjacent
- Page 83 and 84: STRATEGY PARTNERS IMPLEMENTATIONTOO
- Page 85 and 86: control and to help inmaintaining h
- Page 87 and 88: STRATEGY PARTNERS IMPLEMENTATIONTOO
- Page 89 and 90: Tree ProtectionVegetation plays a f
- Page 91 and 92: FARM AND FORESTRYFarm and forest ar
- Page 93 and 94: Energy ElementOverviewThe Energy El
- Page 95 and 96: Existing Energy ConditionsSources a
- Page 97 and 98: ConsumptionIn 2008, South Carolina
- Page 99 and 100: Table EN1: Residential Energy Use f
- Page 101 and 102: Commercial UseThe average South Car
- Page 103 and 104: Auto Use and Fuel ConsumptionThe 20
- Page 105 and 106: the current production that takes p
- Page 107 and 108: Goal: Promote energy efficiency in
- Page 109 and 110: Goal: Promote energy efficiency in
- Page 111 and 112: STRATEGY PARTNERS IMPLEMENTATIONTOO
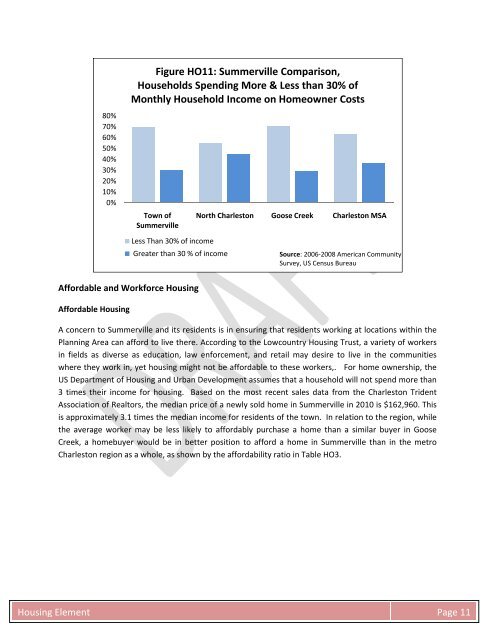
- Page 113 and 114: Housing ElementIntroductionHousing
- Page 115 and 116: Figure HO2: Owner vs. Rental Occupa
- Page 117 and 118: Home Tenure by AgeIn order to antic
- Page 119 and 120: Overcrowdedness of HousingThe prese
- Page 121: Rental HousingAbove: An example of
- Page 125 and 126: Table HO4: Workforce Housing Afford
- Page 127 and 128: Recent DevelopmentWhile the Town ha
- Page 129 and 130: NAMELOCATIONACRES*UNITS# UNITSCompL
- Page 131 and 132: The fiscal impact on a municipality
- Page 133 and 134: HOUSING COSTSHousing affordability
- Page 135 and 136: HOUSING CONDITIONThree indicators c
- Page 137 and 138: HOUSING DEVELOPMENT AND SUBDIVISION
- Page 139 and 140: LegendSubdivisions Approved Since 2
- Page 141 and 142: Community Facilities ElementThe Com
- Page 143 and 144: 3,0002,5002,0001,500Figure CF2: Tre
- Page 145 and 146: The Fire and Rescue Department prov
- Page 147 and 148: Table CF3: Emergency Shelter Locati
- Page 149 and 150: Figure CF4: Water Filtration Use an
- Page 151 and 152: The Town’s Parks and Recreation D
- Page 153 and 154: Table CF4: Parks, Playgrounds, and
- Page 155 and 156: Table CF6: Summerville Sports Leagu
- Page 157 and 158: LibrariesTable CF8: Partial Listing
- Page 159 and 160: Goal: Develop community intolerance
- Page 161 and 162: STRATEGY PARTNERS IMPLEMENTATIONTOO
- Page 163 and 164: Goal: Continue and improve Public F
- Page 165 and 166: Sewage System and Wastewater Treatm
- Page 167 and 168: Stormwater FacilitiesThe Town has c
- Page 169 and 170: UtilitiesDue to rapidly changing te
- Page 171 and 172: Interagency CoordinationThe Summerv
- Page 173 and 174:
AnnexationsWhile defining the Summe
- Page 175 and 176:
LegendAjdacent MunicipalitiesSummer
- Page 177 and 178:
LegendAjdacent MunicipalitiesSummer
- Page 179 and 180:
ÅÆÇ ÅÆÇÅÆÇÅÆÇ ÅÆÇ Å
- Page 181 and 182:
Economic Development ElementOvervie
- Page 183 and 184:
16,00014,00012,00010,0008,0006,0004
- Page 185 and 186:
In looking at the total number of e
- Page 187 and 188:
Table ED4: Largest Employment Sites
- Page 189 and 190:
Figure ED5: Percentage of Residents
- Page 191 and 192:
Table ED6: Existing Office Faciliti
- Page 193 and 194:
NameTable ED8: Summerville Retail C
- Page 195 and 196:
Future Land Use Element. These site
- Page 197 and 198:
InfrastructureBusinesses look at a
- Page 199 and 200:
Downtown DistrictRecent Downtown Bu
- Page 201 and 202:
Figure ED7: Summerville Residents W
- Page 203 and 204:
Figure ED10: Percentage of Workers
- Page 205 and 206:
According to the 2000 US Census, th
- Page 207 and 208:
the 30 bank branches with a Summerv
- Page 209 and 210:
STRATEGY PARTNERS IMPLEMENTATIONTOO
- Page 211 and 212:
INDUSTRIAL DEVELOPMENTThere is a gr
- Page 213 and 214:
DOWNTOWN DISTRICTThe Downtown Distr
- Page 215 and 216:
Goal: Encourage new residential dev
- Page 217 and 218:
COMMERCIAL, MIXED USE, COMMERCIAL A
- Page 219 and 220:
Goal: Attract retail businesses tha
- Page 221 and 222:
!. !. !.!.!.Legend!.RoadsCLASSAvail
- Page 223 and 224:
X. Cultural Resources Element
- Page 225 and 226:
One of the goals of that Plan is to
- Page 227 and 228:
Table CR2: Partial Listing of Summe
- Page 229 and 230:
Gathering PlacesAs identified in th
- Page 231 and 232:
Since 1999, Sculpture in the South
- Page 233 and 234:
Civic OrganizationsOver the years,
- Page 235 and 236:
STRATEGY PARTNERS IMPLEMENTATIONTOO
- Page 237 and 238:
Goal: In accordance with the recomm
- Page 239 and 240:
STRATEGY PARTNERS IMPLEMENTATIONTOO
- Page 241 and 242:
STRATEGY PARTNERS IMPLEMENTATIONTOO
- Page 243 and 244:
STRATEGY PARTNERS IMPLEMENTATIONTOO
- Page 245 and 246:
STRATEGY PARTNERS IMPLEMENTATIONTOO
- Page 247 and 248:
îîîîîîîîî îîîî îî î
- Page 249 and 250:
BCDCOG Travel Demand Modeling Scena
- Page 251 and 252:
Transportation Model AnalysisThe BC
- Page 253 and 254:
Figure 2.8 ‐ Capacity increase wi