Community Snapshotlow compared to the nation, state, county, and all <strong>of</strong> the peer communities.This characteristic is due to, and responsible for, many <strong>of</strong> the other statisticsreported above, such as the median age, average persons per household,median household income and rate <strong>of</strong> poverty. Therefore, the housingconditions and characteristics is an area requiring attention to bring the localhousing market in line with other area communities. Without a proactiveprogram to address the local housing issues, this may be a hindrance in the<strong>City</strong>’s economic development efforts.HOUSING Affordability • • •TABLE 2.6HOUSING AFFORDABILITYPercent <strong>of</strong>AffordableHouseholdMedianMortgageIncomeIncomePayment180% $69,437 $1,736150% $57,864 $1,447120% $46,291 $1,157100% $38,576 $96480% $30,861 $77250% $19,288 $48230% $11,573 $289Source: U.S. Census BureauFIGURE 2.7AGE OF STRUCTURE17%11% 4% 4% 1%32%In <strong>Alvin</strong>, the median household income in 2000 was $38,576, asshown in Table 2.6, Housing Affordability. For housing to beconsidered affordable to a family earning the median householdincome, housing costs could not exceed $964 per month. A familyearning 180 percent <strong>of</strong> the median could afford to pay $1,736 permonth and still consider housing costs affordable. Conversely,households earning only 30 percent <strong>of</strong> the median income can afford$289 in monthly housing related expenses.According to the 2000 Census, <strong>of</strong> the housing units with a mortgage,18.8 percent <strong>of</strong> the household income is spent on monthly ownercosts. The monthly owner costs for housing units without a mortgageis 11.2 percent <strong>of</strong> the household income. The aggregate value <strong>of</strong> allhousing units with a mortgage is $187,282,500 compared to$101,807,500 for those without amortgage, meaning that 35 percent <strong>of</strong>the value <strong>of</strong> owner occupied units iswithout a mortgage. Comparatively,the median contract rent in <strong>Alvin</strong> is$465, which is 23.1 percent <strong>of</strong> thehousehold income. Generally, residents<strong>of</strong> <strong>Alvin</strong> are spending less <strong>of</strong> theirhousehold income on housing than istypical and generally allowed bylenders, which is up to 30 percent.9% 6%16%1999 to March 2000 1995 to 1998 1990 to 19941980 to 1989 1970 to 1979 1960 to 19691950 to 1959 1940 to 1949 1939 or earlierThe average age <strong>of</strong> housing structuresmay be one possible explanation as towhy there is such a high percentage <strong>of</strong>Source: U.S. Census BureauPage 2-16
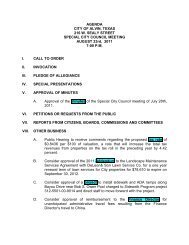
Community Snapshotpersons without a mortgage and why the percent <strong>of</strong> household income spenton housing is less than typical. As displayed in Figure 2.7, Age <strong>of</strong> Structure,<strong>of</strong> the 8,501 housing units in the community, 32 percent were constructedduring the 1970s when the population increased by 89.1 percent. An equalpercentage <strong>of</strong> structures have been built in the twenty five years since 1980.The remaining 38 percent – or 2,993 units – were constructed before 1970. Themedian age <strong>of</strong> structures is, therefore, 30 years old, compared for instance to18 years in Pearland where significant new development is occurring.EDUCATIONAL Attainment • • •The <strong>Alvin</strong> Independent School District (ISD) serves the <strong>City</strong> <strong>of</strong> <strong>Alvin</strong> andsurrounding areas. The district abuts numerous other school districts,including Pearland ISD, Friendswood ISD, Santa Fe ISD, Hitchcock ISD,Danbury ISD, Fort Bend ISD, and Houston ISD, as shown in Figure 2.8, <strong>Alvin</strong>ISD Boundaries. Comparative numbers are presented in Table 2.7,Education Statistics, for the 2002 school year, the most recent year for whichdata has been published by the Texas Education Agency (TEA). In additionto statewide statistics, data is included for each <strong>of</strong> the adjacent schooldistricts, considered for the purpose <strong>of</strong> this analysis as “peer” districts.The comparisons in Table 2.7, Education Statistics, indicate that the <strong>Alvin</strong> ISDhas comparable attendance and annual drop‐outrates with those <strong>of</strong> the peer districts andstatewide. The percentage <strong>of</strong> students whograduated is slightly higher than statewide andthe Santa Fe and Houston districts, yet lowerthan that <strong>of</strong> the other peer districts.Friendswood, for instance, has over a 94 percentgraduation rate. Of those who did not graduate,<strong>Alvin</strong> had a higher percentage <strong>of</strong> those whoreceived GED or continued high school thangenerally all <strong>of</strong> the other districts and statewide.The SAT and ACT scores are each higher thanthe statewide averages and compare favorablywith the other rural districts and relatively closeto those <strong>of</strong> the more urban districts, includingFort Bend, Friendswood, and Pearland. Thepercentage <strong>of</strong> economically disadvantagedstudents is 48.5 percent in <strong>Alvin</strong>, which is lowerthan the state and the Hitchcock and HoustonFIGURE 2.8ALVIN ISD BOUNDARIESSource: Texas Education Agency• The <strong>Alvin</strong> ISD receivedan accountability rating<strong>of</strong> “Exemplary” in 2001‐02, which is only held by11.5 percent <strong>of</strong> alldistricts in Texas• Nearly 30 percent <strong>of</strong>residents have at least ahigh school education,which is in the top tier <strong>of</strong>peer communities• Those with some collegeeducation or anassociate degree accountfor 28 percent and 6.4percent <strong>of</strong> thepopulation, respectively• Retail trade is the singlelargest economic sector,contributing 96establishments, 1,353employees, and anannual payroll <strong>of</strong>$25,168,000Page 2-17
- Page 2 and 3: AcknowledgmentsAlvin “Crossroads
- Page 4 and 5: Table of ContentsHousing Occupancy
- Page 6 and 7: Table of ContentsSustainable provis
- Page 8 and 9: Introduction and VisionAlvin “Cro
- Page 10 and 11: Introduction and VisionVALUE of the
- Page 12 and 13: Introduction and Visioneach of the
- Page 14 and 15: Introduction and Visiondevelopment.
- Page 16 and 17: Community Snapshotposition of the c
- Page 18 and 19: Community Snapshotpoultry, dairying
- Page 20 and 21: Community Snapshot• Persons under
- Page 22 and 23: Community Snapshot• To allow adva
- Page 24 and 25: Community SnapshotIMPLICATIONS of P
- Page 26 and 27: Community SnapshotFIGURE 2.4ETHNIC
- Page 32 and 33: Community SnapshotTABLE 2.7EDUCATIO
- Page 34 and 35: Community Snapshotand 6.4 percent o
- Page 36 and 37: Community SnapshotTABLE 2.9INDUSTRY
- Page 38 and 39: facts & figuresLand Useand communit
- Page 40 and 41: facts & figuresLand UseThe S.H. 35
- Page 42 and 43: facts & figuresLand Useinclude, in
- Page 44 and 45: facts & figuresLand Usehome occupat
- Page 46 and 47: facts & figuresLand UseAlvin reside
- Page 48 and 49: facts & figuresLand UseBenefits of
- Page 50 and 51: facts & figuresLand Usevalue of eac
- Page 52 and 53: facts & figuresLand UseCommunity De
- Page 54 and 55: facts & figuresLand Use3. Amend the
- Page 56 and 57: facts & figuresLand Useintensive co
- Page 58 and 59: facts & figuresLand UseGOAL 3.4: An
- Page 60 and 61: facts & figuresLand Useprogramming
- Page 62 and 63: facts & figuresLand Useaccording to
- Page 64 and 65: facts & figuresLand Usecharacterist
- Page 66 and 67: facts & figuresLand Useintensity of
- Page 68 and 69: facts & figuresLand Useform a very
- Page 70 and 71: facts & figuresLand Useprevailing a
- Page 72 and 73: facts & figuresLand UseFigure 3.2,
- Page 74 and 75: facts & figuresLand UsePreservation
- Page 76 and 77: facts & figuresLand Use• Auto-Urb
- Page 78 and 79:
facts & figuresLand UsePOLICIES for
- Page 80 and 81:
facts & figuresLand Use10. Elementa
- Page 82 and 83:
facts & figuresLand Use4. Smaller s
- Page 84 and 85:
facts & figuresLand Use3. Adequate
- Page 86 and 87:
Parks & RecreationParks planning is
- Page 88 and 89:
Parks & Recreation“People, even t
- Page 90 and 91:
Parks & Recreationsafety sensitive
- Page 92 and 93:
Parks & RecreationKey Features of a
- Page 94 and 95:
Parks & Recreation1. Extend the Tom
- Page 96 and 97:
Parks & RecreationGOAL 4.4: Coopera
- Page 98 and 99:
Parks & RecreationThe parks that ar
- Page 100 and 101:
Parks & RecreationPearson Park is a
- Page 102 and 103:
Parks & RecreationTo assess the ade
- Page 104 and 105:
Parks & Recreationdemand for neighb
- Page 106 and 107:
Parks & RecreationThe area with the
- Page 108 and 109:
Parks & RecreationJOINT USE of Area
- Page 110 and 111:
Parks & RecreationTo develop a syst
- Page 112 and 113:
The design capacity of the roadways
- Page 114 and 115:
Growth StrategiesINTERESTS of the C
- Page 116 and 117:
Growth Strategiesmargin. On smaller
- Page 118 and 119:
Growth Strategiesimproved facilitie
- Page 120 and 121:
Growth StrategiesA common problem o
- Page 122 and 123:
Growth Strategiesdensity of develop
- Page 124 and 125:
Growth Strategiesexisting developme
- Page 126 and 127:
Growth StrategiesImpact Fees - A pa
- Page 128 and 129:
Growth Strategies‣ Provide for th
- Page 130 and 131:
Growth Strategiesgrowth to locate s
- Page 132 and 133:
Growth Strategiesencroachment of pr
- Page 134 and 135:
Growth Strategiesinfrastructure is
- Page 136 and 137:
Growth Strategiesother community fa
- Page 138 and 139:
Growth Strategiesbefore initial col
- Page 140 and 141:
Growth Strategiesyouth‐centered a
- Page 142 and 143:
ImplementationAlvin “Crossroads
- Page 144 and 145:
Implementation• Establish the act
- Page 146 and 147:
Implementationwork closely with the
- Page 148 and 149:
Implementationyear should be recogn
- Page 150 and 151:
ImplementationFurther to the growth
- Page 152 and 153:
ImplementationAction Recommendation
- Page 154 and 155:
ImplementationAction Recommendation
- Page 156 and 157:
Appendix A, Land Use SupplementAlvi
- Page 158 and 159:
Appendix A, Land Use SupplementDeve
- Page 160 and 161:
Appendix A, Land Use Supplementdete
- Page 162 and 163:
Appendix A, Land Use Supplementther
- Page 164 and 165:
Appendix A, Land Use Supplementdwel
- Page 166 and 167:
Appendix A, Land Use Supplementmay
- Page 168 and 169:
Appendix A, Land Use Supplementfact
- Page 170 and 171:
Appendix A, Land Use Supplementwith
- Page 172 and 173:
Appendix A, Land Use SupplementFort
- Page 174 and 175:
Appendix A, Land Use Supplementrela
- Page 176 and 177:
Appendix A, Land Use Supplementlimi
- Page 178 and 179:
Appendix A, Land Use SupplementThe
- Page 180 and 181:
Exhibit B, Park Funding SourcesAlvi
- Page 182 and 183:
Exhibit B, Park Funding SourcesDEPA
- Page 184 and 185:
Exhibit B, Park Funding SourcesCORP
- Page 186 and 187:
Exhibit B, Park Funding SourcesReso
- Page 188 and 189:
Exhibit B, Park Funding Sources(inc
- Page 190 and 191:
Exhibit B, Park Funding Sourcesguid
- Page 192 and 193:
Exhibit B, Park Funding SourcesTo f
- Page 194 and 195:
Exhibit B, Park Funding SourcesClea
- Page 196 and 197:
Exhibit B, Park Funding SourcesInte
- Page 198 and 199:
Exhibit B, Park Funding Sourcesthat
- Page 200 and 201:
Exhibit B, Park Funding SourcesChil