Community SnapshotTABLE 2.7EDUCATION STATISTICSStatistic Texas <strong>Alvin</strong> Danbury Fort Bend Friendswood Hitchcock Houston Pearland Santa FeTotal Number <strong>of</strong> Students 4,239,911 11,736 758 59,217 5,367 1,140 211,762 12,168 4,483Attendance Rate 95.6% 95.4% 95.1% 96.6% 96.5% 94.7% 95.0% 96.5% 95.3%Annual Drop‐Out Rate 0.9% 0.3% 0.0% 0.4% 0.3% 0.2% 1.4% 0.3% 0.9%Completion/Student Status‐ Graduated 82.8% 83.0% 88.7% 89.1% 94.4% 89.0% 75.3% 87.7% 82.9%‐ Received GED 4.1% 7.2% 8.1% 2.9% 2.3% 1.2% 3.2% 4.2% 5.4%‐ Continued High School 8.0% 8.5% 3.2% 4.5% 2.6% 7.3% 12.3% 6.7% 7.3%Mean SAT Score (2002) 986 1011 927 1046 1079 864 939 1035 913Mean ACT Score (2002) 20.0 19.7 20.8 20.4 23.0 12.2 18.5 20.7 18.9Economically Disadvantaged 51.9% 48.5% 21.8% 23.7% 2.6% 62.3% 80.3% 16.9% 22.6%Limited English Pr<strong>of</strong>icient 14.9% 9.5% 5.5% 9.6% 0.6% 4.5% 28.6% 5.4% 1.9%Students per Teacher 14.7 15.1 14.3 16.5 16.5 14.6 17.1 15.7 16.9Average Teacher Experience 11.8 9.9 11.9 10.9 11.8 13.4 11.9 13.6 11.7Average Teacher Salary‐ Beginning Teacher $31,876 $36,398 $37,925 $32,454 $35,147 $28,297 $34,068 $34,387 $33,800‐ Over 20 Years Experience $50,065 $50,538 $48,059 $53,798 $53,260 $45,742 $55,211 $47,818 $46,598Turnover Rate for Teachers 15.6% 18.6% 22.9% 15.6% 12.2% 36.7% 15.2% 17.0% 18.4%Adopted Tax Rate (Total) $1.533 $1.586 $1.541 $1.683 $1.637 $1.711 $1.580 $1.837 $1.570Per Pupil Expenditures $8,381 $6,688 $7,252 $6,796 $6,300 $8,613 $7,636 $7,415 $6,202Bilingual/ESL Enrollment 13.5% 8.9% 5.3% 8.4% 0.5% 3.8% 26.0% 4.8% 1.6%Source: Texas Education AgencyISDs, but higher than Santa Fe, Danbury, and the more urban districts.Students with limited English pr<strong>of</strong>iciency constitute 9.5 percent <strong>of</strong> the studentpopulation, which is less than the state and Fort Bend and Houston schooldistricts. The ratio <strong>of</strong> students to teachers (15.1) is consistent or better thaneach <strong>of</strong> the other districts. The beginning salary is higher for <strong>Alvin</strong> ISD thanall other districts other than Danbury ISD, which likely explains the loweraverage teacher experience <strong>of</strong> 9.9 years. The turnover rate for teachers <strong>of</strong> 18.6percent is higher than the state, but generally consistent with the other peerdistricts. Each <strong>of</strong> the more affluent and urban districts have a higher adoptedtotal tax rate than does <strong>Alvin</strong> ISD, who has a higher rate than the ruraldistricts <strong>of</strong> Danbury and Santa Fe. The per pupil expenditure <strong>of</strong> $6,688 issignificantly less than the state ($8,381) and is also less than each <strong>of</strong> the otherdistricts with the exception <strong>of</strong> Friendswood and Santa Fe. Thebilingual/English as a Second Language (ESL) enrollment is 8.9 percent,which is less than it is statewide, but higher than each <strong>of</strong> the districts otherthan Houston ISD.Page 2-18
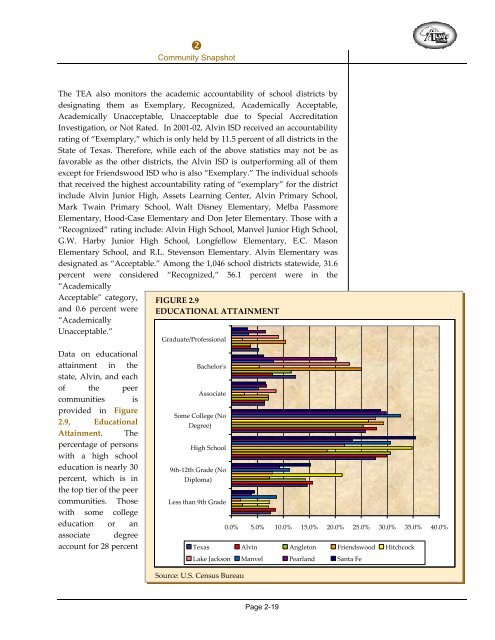
Community SnapshotThe TEA also monitors the academic accountability <strong>of</strong> school districts bydesignating them as Exemplary, Recognized, Academically Acceptable,Academically Unacceptable, Unacceptable due to Special AccreditationInvestigation, or Not Rated. In 2001‐02, <strong>Alvin</strong> ISD received an accountabilityrating <strong>of</strong> “Exemplary,” which is only held by 11.5 percent <strong>of</strong> all districts in theState <strong>of</strong> Texas. Therefore, while each <strong>of</strong> the above statistics may not be asfavorable as the other districts, the <strong>Alvin</strong> ISD is outperforming all <strong>of</strong> themexcept for Friendswood ISD who is also “Exemplary.” The individual schoolsthat received the highest accountability rating <strong>of</strong> “exemplary” for the districtinclude <strong>Alvin</strong> Junior High, Assets Learning Center, <strong>Alvin</strong> Primary School,Mark Twain Primary School, Walt Disney Elementary, Melba PassmoreElementary, Hood‐Case Elementary and Don Jeter Elementary. Those with a“Recognized” rating include: <strong>Alvin</strong> High School, Manvel Junior High School,G.W. Harby Junior High School, Longfellow Elementary, E.C. MasonElementary School, and R.L. Stevenson Elementary. <strong>Alvin</strong> Elementary wasdesignated as “Acceptable.” Among the 1,046 school districts statewide, 31.6percent were considered “Recognized,” 56.1 percent were in the“AcademicallyAcceptable” category,and 0.6 percent were“AcademicallyUnacceptable.”FIGURE 2.9EDUCATIONAL ATTAINMENTGraduate/Pr<strong>of</strong>essionalData on educationalattainment in thestate, <strong>Alvin</strong>, and each<strong>of</strong> the peercommunities isprovided in Figure2.9, EducationalAttainment. Thepercentage <strong>of</strong> personswith a high schooleducation is nearly 30percent, which is inthe top tier <strong>of</strong> the peercommunities. Thosewith some collegeeducation or anassociate degreeaccount for 28 percentBachelorʹsAssociateSome College (NoDegree)High School9th‐12th Grade (NoDiploma)Less than 9th Grade0.0% 5.0% 10.0% 15.0% 20.0% 25.0% 30.0% 35.0% 40.0%Texas <strong>Alvin</strong> Angleton Friendswood HitchcockLake Jackson Manvel Pearland Santa FeSource: U.S. Census BureauPage 2-19
- Page 2 and 3: AcknowledgmentsAlvin “Crossroads
- Page 4 and 5: Table of ContentsHousing Occupancy
- Page 6 and 7: Table of ContentsSustainable provis
- Page 8 and 9: Introduction and VisionAlvin “Cro
- Page 10 and 11: Introduction and VisionVALUE of the
- Page 12 and 13: Introduction and Visioneach of the
- Page 14 and 15: Introduction and Visiondevelopment.
- Page 16 and 17: Community Snapshotposition of the c
- Page 18 and 19: Community Snapshotpoultry, dairying
- Page 20 and 21: Community Snapshot• Persons under
- Page 22 and 23: Community Snapshot• To allow adva
- Page 24 and 25: Community SnapshotIMPLICATIONS of P
- Page 26 and 27: Community SnapshotFIGURE 2.4ETHNIC
- Page 30 and 31: Community Snapshotlow compared to t
- Page 34 and 35: Community Snapshotand 6.4 percent o
- Page 36 and 37: Community SnapshotTABLE 2.9INDUSTRY
- Page 38 and 39: facts & figuresLand Useand communit
- Page 40 and 41: facts & figuresLand UseThe S.H. 35
- Page 42 and 43: facts & figuresLand Useinclude, in
- Page 44 and 45: facts & figuresLand Usehome occupat
- Page 46 and 47: facts & figuresLand UseAlvin reside
- Page 48 and 49: facts & figuresLand UseBenefits of
- Page 50 and 51: facts & figuresLand Usevalue of eac
- Page 52 and 53: facts & figuresLand UseCommunity De
- Page 54 and 55: facts & figuresLand Use3. Amend the
- Page 56 and 57: facts & figuresLand Useintensive co
- Page 58 and 59: facts & figuresLand UseGOAL 3.4: An
- Page 60 and 61: facts & figuresLand Useprogramming
- Page 62 and 63: facts & figuresLand Useaccording to
- Page 64 and 65: facts & figuresLand Usecharacterist
- Page 66 and 67: facts & figuresLand Useintensity of
- Page 68 and 69: facts & figuresLand Useform a very
- Page 70 and 71: facts & figuresLand Useprevailing a
- Page 72 and 73: facts & figuresLand UseFigure 3.2,
- Page 74 and 75: facts & figuresLand UsePreservation
- Page 76 and 77: facts & figuresLand Use• Auto-Urb
- Page 78 and 79: facts & figuresLand UsePOLICIES for
- Page 80 and 81: facts & figuresLand Use10. Elementa
- Page 82 and 83:
facts & figuresLand Use4. Smaller s
- Page 84 and 85:
facts & figuresLand Use3. Adequate
- Page 86 and 87:
Parks & RecreationParks planning is
- Page 88 and 89:
Parks & Recreation“People, even t
- Page 90 and 91:
Parks & Recreationsafety sensitive
- Page 92 and 93:
Parks & RecreationKey Features of a
- Page 94 and 95:
Parks & Recreation1. Extend the Tom
- Page 96 and 97:
Parks & RecreationGOAL 4.4: Coopera
- Page 98 and 99:
Parks & RecreationThe parks that ar
- Page 100 and 101:
Parks & RecreationPearson Park is a
- Page 102 and 103:
Parks & RecreationTo assess the ade
- Page 104 and 105:
Parks & Recreationdemand for neighb
- Page 106 and 107:
Parks & RecreationThe area with the
- Page 108 and 109:
Parks & RecreationJOINT USE of Area
- Page 110 and 111:
Parks & RecreationTo develop a syst
- Page 112 and 113:
The design capacity of the roadways
- Page 114 and 115:
Growth StrategiesINTERESTS of the C
- Page 116 and 117:
Growth Strategiesmargin. On smaller
- Page 118 and 119:
Growth Strategiesimproved facilitie
- Page 120 and 121:
Growth StrategiesA common problem o
- Page 122 and 123:
Growth Strategiesdensity of develop
- Page 124 and 125:
Growth Strategiesexisting developme
- Page 126 and 127:
Growth StrategiesImpact Fees - A pa
- Page 128 and 129:
Growth Strategies‣ Provide for th
- Page 130 and 131:
Growth Strategiesgrowth to locate s
- Page 132 and 133:
Growth Strategiesencroachment of pr
- Page 134 and 135:
Growth Strategiesinfrastructure is
- Page 136 and 137:
Growth Strategiesother community fa
- Page 138 and 139:
Growth Strategiesbefore initial col
- Page 140 and 141:
Growth Strategiesyouth‐centered a
- Page 142 and 143:
ImplementationAlvin “Crossroads
- Page 144 and 145:
Implementation• Establish the act
- Page 146 and 147:
Implementationwork closely with the
- Page 148 and 149:
Implementationyear should be recogn
- Page 150 and 151:
ImplementationFurther to the growth
- Page 152 and 153:
ImplementationAction Recommendation
- Page 154 and 155:
ImplementationAction Recommendation
- Page 156 and 157:
Appendix A, Land Use SupplementAlvi
- Page 158 and 159:
Appendix A, Land Use SupplementDeve
- Page 160 and 161:
Appendix A, Land Use Supplementdete
- Page 162 and 163:
Appendix A, Land Use Supplementther
- Page 164 and 165:
Appendix A, Land Use Supplementdwel
- Page 166 and 167:
Appendix A, Land Use Supplementmay
- Page 168 and 169:
Appendix A, Land Use Supplementfact
- Page 170 and 171:
Appendix A, Land Use Supplementwith
- Page 172 and 173:
Appendix A, Land Use SupplementFort
- Page 174 and 175:
Appendix A, Land Use Supplementrela
- Page 176 and 177:
Appendix A, Land Use Supplementlimi
- Page 178 and 179:
Appendix A, Land Use SupplementThe
- Page 180 and 181:
Exhibit B, Park Funding SourcesAlvi
- Page 182 and 183:
Exhibit B, Park Funding SourcesDEPA
- Page 184 and 185:
Exhibit B, Park Funding SourcesCORP
- Page 186 and 187:
Exhibit B, Park Funding SourcesReso
- Page 188 and 189:
Exhibit B, Park Funding Sources(inc
- Page 190 and 191:
Exhibit B, Park Funding Sourcesguid
- Page 192 and 193:
Exhibit B, Park Funding SourcesTo f
- Page 194 and 195:
Exhibit B, Park Funding SourcesClea
- Page 196 and 197:
Exhibit B, Park Funding SourcesInte
- Page 198 and 199:
Exhibit B, Park Funding Sourcesthat
- Page 200 and 201:
Exhibit B, Park Funding SourcesChil