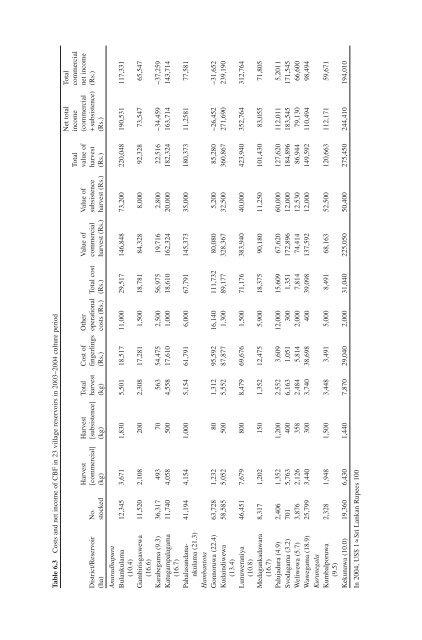
6 Enhancing Rural Farmer <strong>In</strong>come through Fish Production113activities are also made collectively. <strong>In</strong> most instances, aquaculture managementcommittees (AMCs) are established among the FOs, and strategies for stocking,guarding, and harvesting are decided. The members arrive at agreements on sharing<strong>of</strong> CBF pr<strong>of</strong>it between the fish farmers and agricultural farmers. Levy paid by AMC(generally, about 5% <strong>of</strong> the pr<strong>of</strong>it) to FOs is <strong>of</strong>ten used for maintenance <strong>of</strong> thevillage reservoir.The costs involved in CBF and financial benefits derived were evaluated in 23village reservoirs, where reliable information on stocking, total harvest, and marketvalues <strong>of</strong> fish could be gathered (Mr. M.G. Kularatne, pers. comm.). The cost <strong>of</strong>fingerlings was estimated from the unit price <strong>of</strong> Rs. 1.50 per fingerling (Rs. 100 = 1US$), which has been fixed by NAQDA (present price <strong>of</strong> a fingerling is Rs. 2.00).Other costs include that <strong>of</strong> packing, transport, aquaculture license fee, cost <strong>of</strong>guarding stocked fish, and hiring seine nets for harvesting. Also, the levy (generally,about 5% <strong>of</strong> pr<strong>of</strong>it) paid to the FO <strong>of</strong> the reservoir by the AMC was also consideredas part <strong>of</strong> the production cost, because this amount is paid by AMC to FO from theirearnings. The group size <strong>of</strong> AMC varies between 5 and 25, but mostly less than tenmembers. The net pr<strong>of</strong>it (= value <strong>of</strong> harvest − total cost) is shared equally amongthe members <strong>of</strong> the AMC.The CBF harvest varied widely in the 23 village reservoirs (Table 6.3 ). It shouldbe noted that some <strong>of</strong> the reservoirs are connected to seasonal or perennial streams,so that natural recruitment <strong>of</strong> various fish species also occurs. The fish harvests insome reservoirs therefore consisted <strong>of</strong> stocked fish and naturally recruited fish. As inmany reservoirs, 10% <strong>of</strong> the stocked fish was O. niloticus, and their <strong>of</strong>fsprings alsocontributed to the final CBF harvest. High yields in reservoirs where less than 4,000fingerlings were stocked (Table 6.3 ) might be due to the contribution <strong>of</strong> non-stockedfish and reproduction <strong>of</strong> stocked tilapias, to the CBF harvest. The price <strong>of</strong> fish at theharvesting site ranged from Rs. 30 to Rs. 75 per kg. From every harvest, villagerswere provided with fish for home consumption, free-<strong>of</strong>-charge, and this portion <strong>of</strong> theharvest were significant and ranged from 3 to 47% <strong>of</strong> the total. The net pr<strong>of</strong>it (bothfor commercial harvest and total harvest), except in two village reservoirs, wherethere was a financial loss owing to low survival and recovery rates <strong>of</strong> the stocked fish,ranged from Rs. 47,372 to Rs. 729,339 (Rs. 100 = US$ 1). The net pr<strong>of</strong>it in 17 reservoirswas above Rs. 100,000 (Table 6.3 ). The financial loss in the two reservoirs wassolely owing to the high mortality <strong>of</strong> the stocked fish as a result <strong>of</strong> heavy drawdown<strong>of</strong> the reservoir water level. The most common price <strong>of</strong> fish at harvesting point wasRs. 30–40 per kg. <strong>In</strong> a few cases, the prices were higher, up to Rs. 70, especiallywhere the catches were low (Fig. 6.4 ), but the relationship between the farm-gateprice and harvest levels was not significant ( p > 0.05). Although there were price differencesbetween the villages, the price did not appear to influence the choice <strong>of</strong>reservoirs for CBF. The income generated from CBF is essentially dependent on thebiological productivity <strong>of</strong> each reservoir and the development <strong>of</strong> good managementpractices to enhance recovery rates <strong>of</strong> the stocked fish.On an average, 86% <strong>of</strong> the CBF harvest is sold at distant markets. An averageproportion <strong>of</strong> about 13% <strong>of</strong> the harvest is taken by villagers during harvesting. Themobile retailers also sell about 1% <strong>of</strong> the total harvest within the village (Fig. 6.5 ).
Table 6.3 Costs and net income <strong>of</strong> CBF in 23 village reservoirs in 2003–2004 culture periodDistrict/Reservoir(ha)AnuradhapuraBulankulama(10.4)Gambirisgaswewa(16.6)No.stockedHarvest[commercial](kg)Harvest[subsistence](kg)Totalharvest(kg)Cost <strong>of</strong>fingerlings(Rs.)Otheroperationalcosts (Rs.)Total cost(Rs.)Value <strong>of</strong>commercialharvest (Rs.)Value <strong>of</strong>subsistenceharvest (Rs.)Totalvalue <strong>of</strong>harvest(Rs.)Net totalincome(commercial+ subsistence)(Rs.)Totalcommercialnet income(Rs.)12,345 3,671 1,830 5,501 18,517 11,000 29,517 146,848 73,200 220,048 190,531 117,33111,520 2,108 200 2,308 17,281 1,500 18,781 84,328 8,000 92,328 73,547 65,547Karabegama (9.3) 36,317 493 70 563 54,475 2,500 56,975 19,716 2,800 22,516 −34,459 −37,259Katugampalagama 11,740 4,058 500 4,558 17,610 1,000 18,610 162,324 20,000 182,324 163,714 143,714(16.7)Pahalasandanankulama41,194 4,154 1,000 5,154 61,791 6,000 67,791 145,373 35,000 180,373 11,2581 77,581(21.3)HambantotaGonnoruwa (22.4) 63,728 1,232 80 1,312 95,592 16,140 111,732 80,080 5,200 85,280 −26,452 −31,652Kudaindiwewa 58,585 5,052 500 5,552 87,877 1,300 89,177 328,367 32,500 360,867 271,690 239,190(13.4)Lunuweraniya 46,451 7,679 800 8,479 69,676 1,500 71,176 383,940 40,000 423,940 352,764 312,764(10.8)Medagankadawara 8,317 1,202 150 1,352 12,475 5,900 18,375 90,180 11,250 101,430 83,055 71,805(16.7)Palujadura (4.9) 2,406 1,352 1,200 2,552 3,609 12,000 15,609 67,620 60,000 127,620 112,011 5,2011Svodagama (3.2) 701 5,763 400 6,163 1,051 300 1,351 172,896 12,000 184,896 183,545 171,545Weliwewa (5.7) 3,876 2,126 358 2,484 5,814 2,000 7,814 74,414 12,530 86,944 79,130 66,600Wawegama (18.9) 25,799 3,440 300 3,740 38,698 400 39,098 137,592 12,000 149,592 110,494 98,494KurunegalaKumbalporuwa 2,328 1,948 1,500 3,448 3,491 5,000 8,491 68,163 52,500 120,663 112,171 59,671(9.5)Kekunawa (10.0) 19,360 6,430 1,440 7,870 29,040 2,000 31,040 225,050 50,400 275,450 244,410 194,010<strong>In</strong> 2004, US$ 1 » Sri Lankan Rupees 100