Register your product now - Radiometer Analytical
Register your product now - Radiometer Analytical
Register your product now - Radiometer Analytical
Create successful ePaper yourself
Turn your PDF publications into a flip-book with our unique Google optimized e-Paper software.
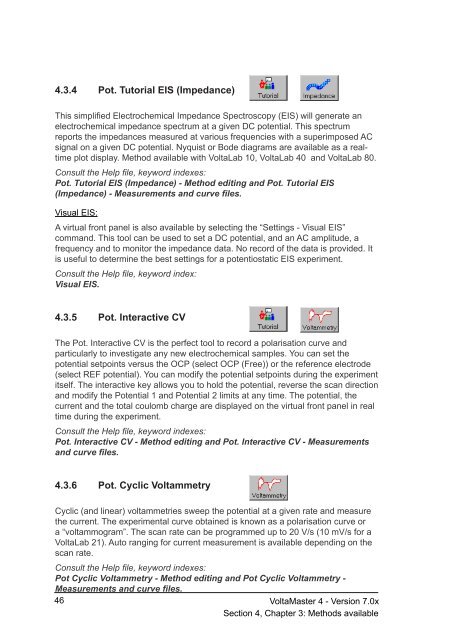
4.3.4 Pot. Tutorial EIS (Impedance)This simplified Electrochemical Impedance Spectroscopy (EIS) will generate anelectrochemical impedance spectrum at a given DC potential. This spectrumreports the impedances measured at various frequencies with a superimposed ACsignal on a given DC potential. Nyquist or Bode diagrams are available as a realtimeplot display. Method available with VoltaLab 10, VoltaLab 40 and VoltaLab 80.Consult the Help file, keyword indexes:Pot. Tutorial EIS (Impedance) - Method editing and Pot. Tutorial EIS(Impedance) - Measurements and curve files.Visual EIS:A virtual front panel is also available by selecting the “Settings - Visual EIS”command. This tool can be used to set a DC potential, and an AC amplitude, afrequency and to monitor the impedance data. No record of the data is provided. Itis useful to determine the best settings for a potentiostatic EIS experiment.Consult the Help file, keyword index:Visual EIS.4.3.5 Pot. Interactive CVThe Pot. Interactive CV is the perfect tool to record a polarisation curve andparticularly to investigate any new electrochemical samples. You can set thepotential setpoints versus the OCP (select OCP (Free)) or the reference electrode(select REF potential). You can modify the potential setpoints during the experimentitself. The interactive key allows you to hold the potential, reverse the scan directionand modify the Potential 1 and Potential 2 limits at any time. The potential, thecurrent and the total coulomb charge are displayed on the virtual front panel in realtime during the experiment.Consult the Help file, keyword indexes:Pot. Interactive CV - Method editing and Pot. Interactive CV - Measurementsand curve files.4.3.6 Pot. Cyclic VoltammetryCyclic (and linear) voltammetries sweep the potential at a given rate and measurethe current. The experimental curve obtained is k<strong>now</strong>n as a polarisation curve ora “voltammogram”. The scan rate can be programmed up to 20 V/s (10 mV/s for aVoltaLab 21). Auto ranging for current measurement is available depending on thescan rate.Consult the Help file, keyword indexes:Pot Cyclic Voltammetry - Method editing and Pot Cyclic Voltammetry -Measurements and curve files.46VoltaMaster 4 - Version 7.0xSection 4, Chapter 3: Methods available


