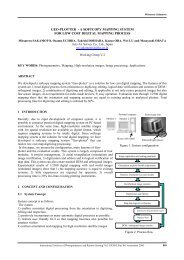
Geoinformation for Disaster and Risk Management - ISPRS
Geoinformation for Disaster and Risk Management - ISPRS
Geoinformation for Disaster and Risk Management - ISPRS

You also want an ePaper? Increase the reach of your titles
YUMPU automatically turns print PDFs into web optimized ePapers that Google loves.
different times of day). Since no two cities are alike,<br />
the transferability of such relationships needs to be<br />
carefully examined. The broadest unit of analysis<br />
considered in this conceptual framework is the<br />
administrative city boundary (Tier 1). At Tier 1, the<br />
approach considers three population estimation<br />
models <strong>for</strong> which processing time, data requirement<br />
<strong>and</strong> cost increase with in<strong>for</strong>mation detail.<br />
Model 1: City population, uses an areal overlay<br />
methodology based on the simplified assumption<br />
that population is uni<strong>for</strong>mly distributed across the<br />
city. This is a very simple case.<br />
Model 2: Urban population, employs Quickbird<br />
satellite images to extract the urban areas (oppose to<br />
non-inhabited regions) in which the population is<br />
supposed to be uni<strong>for</strong>mly distributed. This<br />
assumption is still an oversimplification.<br />
Model 3: Occupancy-based population differentiates<br />
occupancy categories within the urban areas so that<br />
population can be estimated <strong>for</strong> each of the<br />
categories (Figure 2).<br />
92<br />
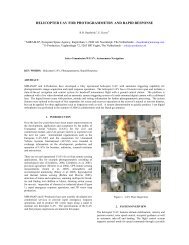
Damage in<strong>for</strong>mation <strong>for</strong> disaster response<br />
There is no substitute <strong>for</strong> real-time or near-real-time<br />
data <strong>and</strong> in<strong>for</strong>mation in the aftermath of a disaster.<br />
Post-event activities require quick <strong>and</strong> accurate<br />
in<strong>for</strong>mation about damage <strong>and</strong> casualties to<br />
coordinate a response to the catastrophe. Within the<br />
re/insurance arena, geographically referenced<br />
damage in<strong>for</strong>mation is vital as an independent<br />
source of loss estimation <strong>and</strong> to determine insurance<br />
claims. For humanitarian relief, estimates of affected<br />
population <strong>and</strong> casualties are critical <strong>for</strong> planning<br />
relief <strong>and</strong> response activities. Although increasingly,<br />
disaster in<strong>for</strong>mation is becoming publicly available<br />
through internet posting, its value is often limited by<br />
the absence of metadata regarding its time <strong>and</strong> geolocation<br />
(e.g., geotagging), both of which are central<br />
to rendering it actionable.<br />
Internet-based loss estimation<br />
One example of a fully-georeferenced risk model is<br />
the Internet-based earthquake loss estimation tool<br />
InLET (Figure 3), designed <strong>and</strong> developed by<br />
ImageCat (www.imagecatinc.com). InLET is the first<br />
online real-time loss estimation system available to<br />
emergency managers <strong>and</strong> responders. Immediately<br />
following an earthquake, the United States<br />
Geological Survey (USGS) broadcasts Internet alerts<br />
using their ShakeCast plat<strong>for</strong>m. InLET which 'listens'<br />
<strong>for</strong> such alerts, is automatically triggered <strong>and</strong><br />
produces loss estimation results based on details of<br />
the earthquake event. Integrating hazard intelligence<br />
with population <strong>and</strong> building inventory data from US<br />
Census Bureau enables loss estimation algorithms to<br />
immediately estimate fatalities <strong>and</strong> building damage<br />
at the level of the census tract. The InLET framework<br />
is readily transferable to other earthquake prone<br />
parts of the World such as India.<br />
Figure 2: Occupancy-based population estimates at Tier 1 using Model 3. The left figure displays the relative day time population<br />
distribution, the right figure displays the population change between day- <strong>and</strong> night-time population.