Geoinformation for Disaster and Risk Management - ISPRS
Geoinformation for Disaster and Risk Management - ISPRS
Geoinformation for Disaster and Risk Management - ISPRS

You also want an ePaper? Increase the reach of your titles
YUMPU automatically turns print PDFs into web optimized ePapers that Google loves.
Combining the 2005 map of building footprints<br />
detailing the start of the rehabilitation phase, with<br />
that of 2007 showing the current state at the time of<br />
case study, provides all the buildings constructed<br />
between clearing the Tsunami debris <strong>and</strong> the end of<br />
the reconstruction period. Overlaying the map of<br />
new houses with the map of administrative<br />
boundaries provides the number <strong>and</strong> locations of<br />
new houses per administrative unit. These numbers<br />
can be compared with the in<strong>for</strong>mation on housing<br />
projects available through the Agency <strong>for</strong><br />
Rehabilitation <strong>and</strong> Reconstruction of NAD <strong>and</strong> Nias<br />
(BRR) Recovery Aceh Nias Database (RAND)<br />
database <strong>and</strong> other project in<strong>for</strong>mation. Lay-out<br />
plans of housing projects existed only as paper<br />
sketches.<br />
Based on location <strong>and</strong> degree of completion, as<br />
detected by comparing the building footprint maps,<br />
the Indonesian SAI, Badan Pemeriksa Keuangan RI<br />
(BPK) can take a stratified r<strong>and</strong>om or stratified<br />
systematic sample of these projects, <strong>for</strong> auditing<br />
according to its audit objective. Fraud is likely if<br />
there is a large discrepancy between the quantities<br />
of houses built according to the RAND database or<br />
project in<strong>for</strong>mation, <strong>and</strong> the map of new houses. In<br />
such a case, the BPK field teams may want to take<br />
extra field samples to determine the reason <strong>for</strong> this<br />
discrepancy. Visualizing the spatial distribution of<br />
contractors <strong>and</strong> projects on maps shows the auditors<br />
whether there were likely to be any monopolies of<br />
building contractors in certain areas, <strong>and</strong> focus their<br />
audits accordingly. Using the map of new houses, the<br />
audit data of the houses in the sample can be<br />
extrapolated <strong>for</strong> the whole study area.<br />
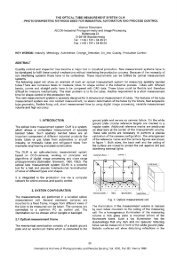
Figure 2: GIS based method <strong>for</strong> auditing housing projects<br />
In the case of the housing audit conducted by the SAI<br />
of Indonesia (BPK), the results of the analysis of the<br />
KOMPSAT-2 imagery providing the housing<br />
footprints <strong>for</strong> 2007, were not ready be<strong>for</strong>e the field<br />
teams started their survey, so the method shown in<br />
Figure 2, was adapted (Bijker <strong>and</strong> Sanjaya 2008).<br />
While the field teams of the BPK were conducting<br />
their survey, suitable remote sensing methods were<br />
developed to detect houses on the KOMPSAT-2<br />
imagery <strong>and</strong> used to create the map of new houses<br />
<strong>for</strong> selected sites (Du 2008).<br />
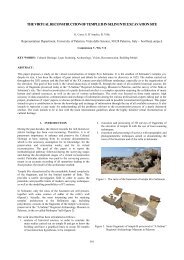
The field teams took copies of the 2005 orthophotos<br />
to the field <strong>and</strong> delineated the sites of the housing<br />
projects on these images, as shown in Figure 3. The<br />
project delineations of the field teams were digitized<br />
<strong>and</strong> combined with the map of new houses. In this<br />
way, thematic (audit) data of the housing projects<br />
could be related to the new houses mapped from the<br />
imagery.<br />
85