Geoinformation for Disaster and Risk Management - ISPRS
Geoinformation for Disaster and Risk Management - ISPRS
Geoinformation for Disaster and Risk Management - ISPRS

Create successful ePaper yourself
Turn your PDF publications into a flip-book with our unique Google optimized e-Paper software.
Volcanic ash measured by NASA-MODIS<br />
satellites<br />
November 24th 2006, at about 03:00 UTC, a<br />
paroxysmal event occurred with ash emission lasting<br />
about 14 hours (Andronico at al., 2009; Figure 4a).<br />
This event produced the largest volume of ash in the<br />
entire September-December eruptive period. On that<br />
day the wind was blowing from the N-NW direction.<br />
A change in wind direction caused the ash plume to<br />
move towards the city of Catania. The episode was<br />
recorded at 12:20 UTC by MODIS on board Aqua<br />
satellite (Figure 4b). The finest ash travelled more<br />
than 80km from the summit craters. The ash fallout<br />
caused the closure of Catania Airport.<br />
The pre-operative test went through the following<br />
steps:<br />
1) The DPC requested activation of the EO<br />
volcanic ash product to project partners with an<br />
observation pre<strong>for</strong>matted report.<br />
2) Ingestion: after pre-processing, the MODIS<br />
data acquired from Telespazio through the Matera<br />
ground receiving station were automatically sent to<br />
INGV in near-real time.<br />
80<br />
3) Core process: INGV ran its scientific models<br />
<strong>and</strong> algorithms in order to derive the EO product.<br />
The Brightness Temperature Difference procedure<br />
with the atmospheric water vapour correction was<br />
applied to infrared MODIS channels to detect<br />
volcanic ash, discriminate it from meteorological<br />
clouds <strong>and</strong> identify the affected area. The retrieved<br />
mean ash optical thickness at 0.55n µ, the mean ash<br />
particle radius <strong>and</strong> the ash loading in the plume<br />
were derived to be 0.4, 3.5 µ <strong>and</strong> 3620 tons<br />
respectively.<br />
4) Distribution: ACS developed an interactive<br />
web-interface (Figure 5a) linked to the main Web-<br />
GIS in the Crisis risk management phase. INGV<br />
created the pre<strong>for</strong>matted observation report with<br />
the volcanic ash in<strong>for</strong>mation on: area affected by<br />
volcanic ash, the volcanic plume dispersal direction;<br />
dimensions <strong>and</strong> altitude in the atmosphere <strong>and</strong> the<br />
volcanic ash loading (Figure 5b). The pre<strong>for</strong>matted<br />
observation report was published in the Web-GIS via<br />
WMS st<strong>and</strong>ard protocol (Figure 6).<br />
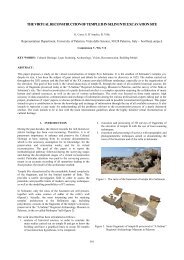
Figure 4: Mt. Etna ash plume on 24 November 2006: a) picture taken 30 km from summit carters<br />
(photo courtesy of B. Behncke); b) MODIS data on Aqua RGB image.<br />
Total time processing was estimated to be less than 1<br />
hour, after receiving MODIS data. The test end when<br />
the eruption terminated in late December.<br />
Figure 5: This image shows the report creation:<br />
a) Interactive web-interface where INGV insert<br />
the volcanic ash in<strong>for</strong>mation; b) Web-published<br />
pre<strong>for</strong>matted observation report.