Geoinformation for Disaster and Risk Management - ISPRS
Geoinformation for Disaster and Risk Management - ISPRS
Geoinformation for Disaster and Risk Management - ISPRS

Create successful ePaper yourself
Turn your PDF publications into a flip-book with our unique Google optimized e-Paper software.
processing chains to finally derive a more robust<br />
OBIA rule set, leading to more reliable results in<br />
general. The camp areas were delineated<br />
automatically according to a certain threshold in<br />
dwelling density.<br />
IDP or refugee camps themselves have an impact on<br />
the surrounding environment due to the additional<br />
dem<strong>and</strong> of the scarce local resources such as water,<br />
grazing areas <strong>and</strong> firewood. Estimating the<br />
magnitude of such impact is of considerable<br />
importance with respect firstly to the sustainability<br />
of camps <strong>and</strong> secondly to conflict prevention. There<br />
is growing concern about the environmental impact<br />
of Darfur's conflict, in particular the impact on<br />
Darfur's wood resources which were already being<br />
depleted at an estimated rate of 1% per annum<br />
be<strong>for</strong>e the conflict (UNEP 2008). In situations such<br />
as Darfur this depletion also has an impact on the<br />
security of the IDPs because the depletion of<br />
resources <strong>for</strong>ces them to collect firewood further<br />
away from the camps, increasing the risk of attack<br />
(UNEP, 2008). The detection <strong>and</strong>, where possible the<br />
quantification of this impact, may provide important<br />
in<strong>for</strong>mation <strong>for</strong> the management of these camps. A<br />
st<strong>and</strong>ard application <strong>for</strong> the detection of changes<br />
with satellite imagery is the analysis of archive<br />
satellite data with coarse geometric but high<br />
temporal resolution <strong>for</strong> a defined observation<br />
period. Such an analysis aims to detect spatial trend<br />
patterns, which are an important factor in long-term<br />
environmental studies. In this study a time-series<br />
analysis of MODIS satellite data from January 2002<br />
to July 2008 was based on the calculation <strong>and</strong><br />
comparison of the Enhanced Vegetation Index (EVI)<br />
of 16-day maximum value composites with a spatial<br />
resolution of 250m.<br />
54<br />
Results<br />
Camp population estimates<br />
Satellite-based extraction of dwellings does not<br />
provide rigorous evidence of the actual number of<br />
people present at the time of data capture. However,<br />
the number of satellite data derived “dwellings”<br />
provides a proxy <strong>for</strong> the number of people present at<br />
the time of data acquisition. As no field data about<br />
the average household sizes per tent were available<br />
<strong>for</strong> Zam Zam <strong>and</strong> Zalingei, three different scenarios<br />
were generated <strong>for</strong> the estimation of population<br />
figures. These were based on the number of<br />
extracted dwellings, various figures from published<br />
literature (Giada et al., 2003; Bush, 1988; UNHCR,<br />
2006) <strong>and</strong> oral communications with Médecins Sans<br />
Frontières (MSF), Intersos <strong>and</strong> UNHCR. Depending<br />
on the particular scenario used <strong>for</strong> the dwelling<br />
extraction from the satellite images, these figures<br />
have shown good agreements with official<br />
population data from the Humanitarian Needs<br />
Profile (HNP) of UN OCHA (United Nations Office <strong>for</strong><br />
the Coordination of Humanitarian Affairs) (OCHA,<br />
2007).<br />
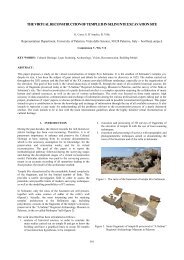
One of the main requests of the WFP was the<br />
estimation of population using the number of<br />
dwelling structures as a proxy. To obtain a reference<br />
dataset, visual interpretations were carried out, as it<br />
was assumed that this method would provide the<br />
most accurate results <strong>for</strong> mapping single buildings<br />
within the IDP camps. This reference data served<br />
then as a comparison of four automatic or semiautomatic<br />
extraction approaches. The four methods<br />
showed different results. A common problem with all<br />
methods was that side-by-side buildings were<br />
detected as a single building leading to an<br />
underestimation of the number of dwellings. Some<br />
buildings were not automatically recognized,<br />
because they have similar spectral characteristics as<br />
ground. In contrast, an overestimation was observed<br />
in other parts because potential “buildings” proved<br />
to be fences, shadows or bare soil.<br />
The results show a large variation between the<br />
different approaches, reaching more than ± 30%<br />
difference between automatic <strong>and</strong> visually counted<br />
dwellings (Table 1).<br />
Method Dorti Ardamata Um Dukhum North<br />
Visual Interpretation 3636 6394 14257<br />
OBIA 1 2352 4869 10281<br />
OBIA 2 2523 3965 15349<br />
Pixel-based Approach 2142 3368 12277<br />
Mathematical Morphology 1 2806 6938 14032<br />
Mathematical Morphology 2 2800 5800 18650<br />
Table 1: Dwelling estimates <strong>for</strong> the three camps using different approaches