Geoinformation for Disaster and Risk Management - ISPRS
Geoinformation for Disaster and Risk Management - ISPRS
Geoinformation for Disaster and Risk Management - ISPRS

You also want an ePaper? Increase the reach of your titles
YUMPU automatically turns print PDFs into web optimized ePapers that Google loves.
The largest differences occur in the northern part of<br />
Um Dukhum, which can be attributed to the fact that<br />
this camp is much more widespread, including more<br />
open spaces, trees <strong>and</strong> rock outcrops compared to<br />
Dorti or Ardamata sites. Also there is no clear<br />
separation between host community <strong>and</strong> IDP's <strong>and</strong><br />
there was no camp map available that would allow<br />
the exclusion of public facilities. The table shows that<br />
there is no clear pattern to be followed. A final<br />
assessment of the accuracy will be possible only with<br />
field assessments (the field validation planned <strong>for</strong><br />
October 2009 had to be interrupted <strong>for</strong> security<br />
reasons).<br />
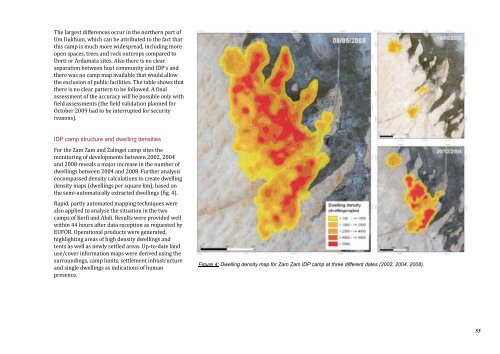
IDP camp structure <strong>and</strong> dwelling densities<br />
For the Zam Zam <strong>and</strong> Zalingei camp sites the<br />
monitoring of developments between 2002, 2004<br />
<strong>and</strong> 2008 reveals a major increase in the number of<br />
dwellings between 2004 <strong>and</strong> 2008. Further analysis<br />
encompassed density calculations to create dwelling<br />
density maps (dwellings per square km), based on<br />
the semi-automatically extracted dwellings (fig. 4).<br />
Rapid, partly automated mapping techniques were<br />
also applied to analyse the situation in the two<br />
camps of Kerfi <strong>and</strong> Abdi. Results were provided well<br />
within 44 hours after data reception as requested by<br />
EUFOR. Operational products were generated,<br />
highlighting areas of high density dwellings <strong>and</strong><br />
tents as well as newly settled areas. Up-to-date l<strong>and</strong><br />
use/cover in<strong>for</strong>mation maps were derived using the<br />
surroundings, camp limits, settlement infrastructure<br />
<strong>and</strong> single dwellings as indications of human<br />
presence.<br />
Figure 4: Dwelling density map <strong>for</strong> Zam Zam IDP camp at three different dates (2002, 2004, 2008).<br />
55