Geoinformation for Disaster and Risk Management - ISPRS
Geoinformation for Disaster and Risk Management - ISPRS
Geoinformation for Disaster and Risk Management - ISPRS

Create successful ePaper yourself
Turn your PDF publications into a flip-book with our unique Google optimized e-Paper software.
SIntroduction<br />
Audit of Indian Ocean<br />
Tsunami Aid in Aceh<br />
with Geo-in<strong>for</strong>mation<br />
Wietske Bijker*, Egbert Jongsma**,<br />
Richard A Kidd ***<br />
* Faculty of Geo-in<strong>for</strong>mation Science <strong>and</strong> Earth Observation<br />
(ITC), University of Twente, Enschede, The Netherl<strong>and</strong>s,<br />
bijker@itc.nl<br />
**Netherl<strong>and</strong>s Court of Audit, The Hague, The Netherl<strong>and</strong>s,<br />
e.jongsma@rekenkamer.nl<br />
***Geospatial Consultant, Cairo, Egypt,<br />
richard.a.kidd@gmail.com<br />
Supreme Audit Institutions (SAIs) have a role in<br />
safeguarding the spending of public funds by<br />
providing assurance with their audit activities: they<br />
provide assurance on the financial statements of<br />
government <strong>and</strong> public entities. Auditing also has<br />
another important function besides assurance; it is a<br />
learning tool <strong>for</strong> management that provides an<br />
assessment of weaknesses <strong>and</strong> strengths in<br />
per<strong>for</strong>mance.<br />
SAIs have a role in assessing whether governments<br />
<strong>and</strong> public entities are well prepared <strong>for</strong> natural<br />
disasters (disaster preparedness <strong>and</strong> risk<br />
mitigation). They also have a role when disasters<br />
happen <strong>and</strong> government <strong>and</strong> public entities are<br />
planning, coordinating, funding <strong>and</strong> implementing<br />
disaster-relief ef<strong>for</strong>ts.<br />
When the Indian Ocean Tsunami happened in 2004,<br />
the 189 members of the international organisation<br />
of SAIs (INTOSAI) realised that this disaster would<br />
also have an effect on the SAIs from affected <strong>and</strong><br />
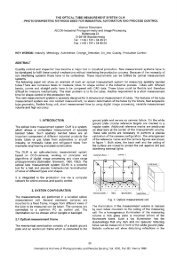
Figure 1: Map of newly built houses in Lampuuk Village with contractor zones, projected on a 2007 KOMPSAT-2 image. The<br />
entire village is within 2 kilometres of the coastline. Individual houses are indicated by symbols (green = inhabited, red = not<br />
inhabited). The map was made by BPK staff during a training course (Source: SAADRA Program TF 057426). KOMPSAT-2<br />
image courtesy of Korean Aerospace Institute (KARI).<br />
83