Geoinformation for Disaster and Risk Management - ISPRS
Geoinformation for Disaster and Risk Management - ISPRS
Geoinformation for Disaster and Risk Management - ISPRS

You also want an ePaper? Increase the reach of your titles
YUMPU automatically turns print PDFs into web optimized ePapers that Google loves.
priority. The updated large scale reference layers<br />
were uploaded into the SDI reference datasets,<br />
allowing the creation of raster maps based on<br />
customized templates (figure 8).<br />
The dissemination process was based on typical<br />
Figure 5: Coordination Grid (red lines) over the area of<br />
interest (green polygon show analyzed cells)<br />
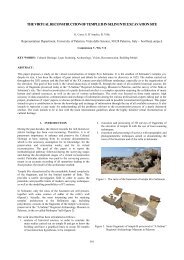
Figure 6: Example of damage assessment in the central<br />
area of Port-au-Prince<br />
methods of data dissemination, including: delivery<br />
as an attachment to e-mails to a pre-defined mailing<br />
list; inclusion into web pages, where a search engine<br />
would help in identifying the searched product; <strong>and</strong><br />
delivery to specific GeoRSS portals. The focus was on<br />
emergency management <strong>and</strong> a large circulation.<br />
Because of the impact of the Haiti earthquake <strong>and</strong><br />
the number of GIS specialist asking <strong>for</strong> raw data, an<br />
ad-hoc web application was specifically designed<br />
<strong>and</strong> implemented, allowing to display <strong>and</strong> query the<br />
available datasets <strong>and</strong> also to edit specific features of<br />
interest (Figure 9).<br />
User feedback<br />
In an emergency, WFP needs in<strong>for</strong>mation more than<br />
almost anything else, to be able to respond quickly<br />
<strong>and</strong> effectively <strong>and</strong> to plan the next phase of its<br />
operation. The mapping products provided by<br />
ITHACA in the emergency response phase were very<br />
visual <strong>and</strong> easy <strong>for</strong> staff without a GIS background to<br />
use. They gave a very clear picture to both field staff<br />
<strong>and</strong> decision makers at WFP headquarters. WFP's<br />
logistics teams used the maps to know where they<br />
could open access routes, where warehouses could<br />
be erected, where hospitals were located so that <strong>for</strong><br />
example, injured people <strong>and</strong> their families could be<br />
helped. The maps told WFP staff where spontaneous<br />
camps <strong>for</strong> displaced people were springing up <strong>and</strong><br />
where roads were passable to reach them.<br />
Distribution sites could then be set up as closely as<br />
possible so that as many vulnerable people as<br />
possible could be reached. When security during<br />
food distributions became a concern, WFP staff could<br />
find alternative routes by inspecting the maps, thus<br />
allowing them to get their job done as safely as<br />
possible in a very complex <strong>and</strong> challenging<br />
environment.<br />
Figure 7: OpenStreetMap coverage over Port-au-<br />
Prince be<strong>for</strong>e the earthquake (top), as of February<br />
15th (centre) <strong>and</strong> February, 26th (bottom)<br />
35