Geoinformation for Disaster and Risk Management - ISPRS
Geoinformation for Disaster and Risk Management - ISPRS
Geoinformation for Disaster and Risk Management - ISPRS

You also want an ePaper? Increase the reach of your titles
YUMPU automatically turns print PDFs into web optimized ePapers that Google loves.
Health alerts<br />
As an example of health interventions, the<br />
Albuquerque Public Schools (APS) in New Mexico,<br />
USA has developed an asthma action plan <strong>and</strong><br />
st<strong>and</strong>ing orders <strong>for</strong> intervening, mitigating, <strong>and</strong><br />
treating registered asthmatic students. The action<br />
plan has three well defined categories of symptoms.<br />
Mild symptoms are addressed by the classroom<br />
teacher; moderate symptoms are addressed by a<br />
school nurse or other medical provider; <strong>and</strong> severe<br />
symptoms are addressed by emergency response<br />
personnel. These categories provide a health basis<br />
<strong>for</strong> dust <strong>for</strong>ecasts that can be e-mailed, faxed, text<br />
messaged, or twittered to the APS Nursing Service,<br />
<strong>and</strong> sent to print <strong>and</strong> broadcast media.<br />
Forty-eight-hour <strong>for</strong>ecasts of atmospheric dust are<br />
produced daily <strong>and</strong> made available at<br />
http://phairs.unm.edu, <strong>and</strong><br />
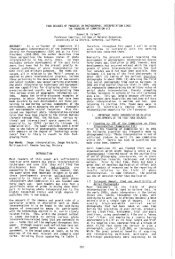
http://nmtracking.unm.edu. Figure 4 captures a<br />
storm crossing southeast Arizona <strong>and</strong> southwest<br />
New Mexico on Jan 6-8, 2008. Individuals at Wilcox<br />
<strong>and</strong> Silver City could view an animation of the dust<br />
<strong>for</strong>ecast that ran from 5:00pm (local time) on Jan 6th<br />
through midnight on Jan 8th. At left is a clip from the<br />
animation centered on the hour of peak dust<br />
concentration. The graphs at right show the peak<br />
hour <strong>and</strong> magnitudes <strong>for</strong> Wilcox Playa (blue curve)<br />
<strong>and</strong> Silver City (red curve). There is a precursor,<br />
lower concentration episode at both locations, but<br />
Wilcox was eventually hit with three high<br />
concentration episodes over the <strong>for</strong>ecast period.<br />
School nurses in the Albuquerque Public Schools<br />
prefer a dust alert system that obviates referring to<br />
websites or interpreting graphs. They favor a daily<br />
written synopsis of dust <strong>and</strong> air quality conditions<br />
across the school District.<br />
Figure 4: (left), Dust patterns at 1pm on Jan 7th. High concentrations are red <strong>and</strong> orange colors; low concentrations are<br />
green <strong>and</strong> yellow colors. (right), Timing of peak dust concentrations. The pattern at left is <strong>for</strong> the hour shown on the<br />
vertical bar at right.<br />
Using Figure 4(right) as an example, a synopsis of<br />
dust <strong>for</strong>ecasts might read as follows:<br />
�Wilcox <strong>and</strong> vicinity: For January 6-8, expect<br />
moderate windblown dust late in the evening on<br />
the 6th, dissipating gradually throughout the<br />
evening <strong>and</strong> early morning hours but increasing<br />
<strong>and</strong> peaking in concentration to unhealthy levels<br />
between noon <strong>and</strong> 3pm on the 7th. There is a<br />
chance <strong>for</strong> moderate dust between 6 <strong>and</strong> 8am on<br />
the 8th.<br />
�Silver City <strong>and</strong> vicinity: For January 6-8,<br />
expect conditions as in Wilcox on the 6th. For the<br />
7th, expect a sharp rise in dust concentration to<br />
unhealthy levels between noon <strong>and</strong> 7pm, <strong>and</strong><br />
remaining high until after midnight. Expect<br />
diminishing dust on the 8th.<br />
Epidemiology<br />
Epidemiologists can gain access to archives of dust<br />
simulations in the southwestern USA at<br />
http://nmtracking.unm.edu. Products are integrated<br />
into client interfaces to visualize raster images<br />
derived from the modeling system <strong>and</strong> to combine<br />
them with routine GIS operations. These data<br />
represent a step toward examining geographically<br />
explicit dust patterns <strong>for</strong> analyses of hospital<br />
admissions, or doctor visits that might have resulted<br />
from chronic, high level dust exposures.<br />
49