- Page 1 and 2:
January - March 2006 Volume 40 Numb
- Page 3 and 4:
KASETSART JOURNAL NATURAL SCIENCE T
- Page 5 and 6:
In sacco Degradation Characteristic
- Page 7 and 8:
2 and management practices a sorghu
- Page 9 and 10:
4 the greater plant height was obta
- Page 11 and 12:
6 at Wolenchity (Figure 3) that led
- Page 13 and 14:
8 Stover and aboveground biomass Co
- Page 15 and 16:
10 Radford, B.J., A.J. Dry, L.N. Ro
- Page 17 and 18:
12 At present, new cultivars with h
- Page 19 and 20:
14 2000), grapevine (Lavee, 2000),
- Page 21 and 22:
16 repeatability of FW, FLT, FLW, S
- Page 23 and 24:
18 (Table 5) indicating that select
- Page 25 and 26:
Kasetsart J. (Nat. Sci.) 40 : 20 -
- Page 27 and 28:
22 measured to define fruit shape i
- Page 29 and 30:
24 for higher fruit number and yiel
- Page 31 and 32:
Kasetsart J. (Nat. Sci.) 40 : 26 -
- Page 33 and 34:
28 (Table 2). The numbers of flower
- Page 35 and 36:
30 to the color of fruit and seed c
- Page 37 and 38:
32 1999. Carrots and related vegeta
- Page 39 and 40:
34 MATERIALS AND METHODS Laboratory
- Page 41 and 42:
36 DISCUSSION Extensive studies hav
- Page 43 and 44:
38 from Gossypium hirsutum. J. Inse
- Page 45 and 46:
40 The natural resistance of plants
- Page 47 and 48:
42 4. Data collection and statistic
- Page 49 and 50:
44 was not significantly different
- Page 51 and 52:
46 showed the highest yield compare
- Page 53 and 54:
48 Kessmann, H., T. Staub, C. Hofma
- Page 55 and 56:
50 There are approximately 60 comme
- Page 57 and 58:
52 in PBST containing 2% ovalbumin
- Page 59 and 60:
54 Kasetsart J. (Nat. Sci.) 40(1) T
- Page 61 and 62:
56 Virus-free orchid plants show fa
- Page 63 and 64:
Kasetsart J. (Nat. Sci.) 40 : 58 -
- Page 65 and 66:
60 feed source was based on purchas
- Page 67 and 68:
62 intake of DM, CP, ether extract
- Page 69 and 70:
64 relatively slow and short. The p
- Page 71 and 72:
66 week 4. Milk composition was not
- Page 73 and 74:
68 Agricultural Experiment Station.
- Page 75 and 76:
70 et al., 2002). In contrast to ma
- Page 77 and 78:
72 level and showed marked polymorp
- Page 79 and 80:
Kasetsart J. (Nat. Sci.) 40 : 74 -
- Page 81 and 82:
76 loam (Eutric Fluvisol) soil and
- Page 83 and 84:
78 Eugenia caryophyllata, Echinops
- Page 85 and 86:
80 CONCLUSION In conclusion, out of
- Page 87 and 88:
82 of chromic acid titration method
- Page 89 and 90:
84 initials at the time of pinning
- Page 91 and 92:
86 vessels a point where the number
- Page 93 and 94:
88 Kasetsart J. (Nat. Sci.) 40(1) T
- Page 95 and 96:
90 CONCLUSIONS In the investigation
- Page 97 and 98:
92 1994; Strand et al., 1997). Now
- Page 99 and 100:
94 The clones were grown overnight
- Page 101 and 102:
96 isozymes. The copy number for nu
- Page 103 and 104:
98 Helianthus annuus. Theor. Appl.
- Page 105 and 106:
100 MATERIALS AND METHODS Plant mat
- Page 107 and 108:
102 The amount of Na + (%) 6 5 4 3
- Page 109 and 110:
104 NGE, 7-16 folds). Finally, all
- Page 111 and 112:
106 Anal. Biochem. 162: 156-159. Cr
- Page 113 and 114:
108 grown for academic purpose at N
- Page 115 and 116:
110 Cluster A was further separated
- Page 117 and 118:
112 Table 2 Similarity index of 19
- Page 119 and 120:
114 subjected to UPGMA and resultin
- Page 121 and 122:
116 Tabel 3 The similarity index of
- Page 123 and 124:
118 formation as seen from phylogen
- Page 125 and 126:
120 Genet. 101: 860-864. Lerceteau,
- Page 127 and 128:
122 INTRODUCTION Methylotrophic yea
- Page 129 and 130:
124 RESULTS AND DISCUSSION Screenin
- Page 131 and 132: 126 optimum temperature, insignific
- Page 133 and 134: 128 medium of C. boidinii (Volfova
- Page 135 and 136: 130 was observed soon after 24h cul
- Page 137 and 138: 132 Kasetsart J. (Nat. Sci.) 40(1)
- Page 139 and 140: 134 ACKNOWLEDGEMENTS This work was
- Page 141 and 142: Kasetsart J. (Nat. Sci.) 40 : 136 -
- Page 143 and 144: 138 Determination of enzyme activit
- Page 145 and 146: 140 Table 1 Optimum and stability o
- Page 147 and 148: 142 for example recombinant E. coli
- Page 149 and 150: 144 were studied for β-1,3-1,4-glu
- Page 151 and 152: 146 ACKNOWLEDGEMENT This work was s
- Page 153 and 154: Kasetsart J. (Nat. Sci.) 40 : 148 -
- Page 155 and 156: 150 vulcanization times were calcul
- Page 157 and 158: 152 RESULTS AND DISCUSSION Mechanic
- Page 159 and 160: 154 Kasetsart J. (Nat. Sci.) 40(1)
- Page 161 and 162: 156 blend with 0.5 phr Irganox. How
- Page 163 and 164: Kasetsart J. (Nat. Sci.) 40 : 158 -
- Page 165 and 166: 160 (AA-680 ShiMADZU, Atomic Absorp
- Page 167 and 168: 162 warm, relatively shallow and hi
- Page 169 and 170: 164 cycle in crustacean (Chen et al
- Page 171 and 172: 166 Salaenoi, J. 2004. Changes of e
- Page 173 and 174: 168 MATERIALS AND METHODS This rese
- Page 175 and 176: 170 DISCUSSION The average total am
- Page 177 and 178: Kasetsart J. (Nat. Sci.) 40 : 172 -
- Page 179 and 180: 174 repacked and scanned three time
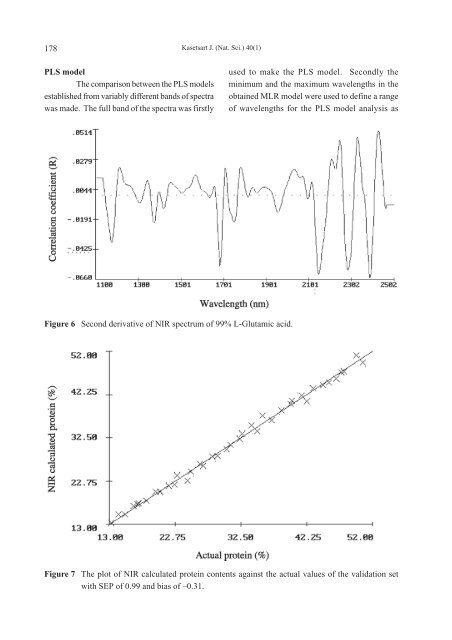
- Page 181: 176 found the most in the shrimp fe
- Page 185 and 186: 180 brix value and dry matter of ma
- Page 187 and 188: 182 approach to increase immunity t
- Page 189 and 190: 184 higher (P
- Page 191 and 192: 186 levels were significantly eleva
- Page 193 and 194: Kasetsart J. (Nat. Sci.) 40 : 188 -
- Page 195 and 196: 190 currents. Zone 4: River outlet
- Page 197 and 198: 192 standing waters, thus the occur
- Page 199 and 200: 194 and moving to 59%TL in juvenile
- Page 201 and 202: Kasetsart J. (Nat. Sci.) 40 : 196 -
- Page 203 and 204: 198 thin membrane (Figure 1A, B). T
- Page 205 and 206: 200 were clearly seen. The presence
- Page 207 and 208: 202 could change to female at 6-12
- Page 209 and 210: Kasetsart J. (Nat. Sci.) 40 : 204 -
- Page 211 and 212: 206 water until the water became cl
- Page 213 and 214: 208 reported by Thu and Preston (19
- Page 215 and 216: 210 cavalcade hay. The crude protei
- Page 217 and 218: 212 CONCLUSIONS Ruminal disappeared
- Page 219 and 220: 214 ∅rskov, E.R. and I. McDonald.
- Page 221 and 222: 216 is constrained mainly due to fa
- Page 223 and 224: 218 SNF and fat composition in raw
- Page 225 and 226: 220 in terms of both manual samplin
- Page 227 and 228: 222 Harding, F. 1995. Compositional
- Page 229 and 230: 224 proteins described by Barbut an
- Page 231 and 232: 226 starch/flour, shaken vigorously
- Page 233 and 234:
228 % Stress relaxation 54 49 44 39
- Page 235 and 236:
230 Kasetsart J. (Nat. Sci.) 40(1)
- Page 237 and 238:
Kasetsart J. (Nat. Sci.) 40 : 232 -
- Page 239 and 240:
234 categories including puffed sna
- Page 241 and 242:
236 Cohesiveness of mass Crispness
- Page 243 and 244:
238 Cohesiveness of mass Sweetness
- Page 245 and 246:
Kasetsart J. (Nat. Sci.) 40 : 240 -
- Page 247 and 248:
242 3. Physicochemical properties 3
- Page 249 and 250:
244 Kasetsart J. (Nat. Sci.) 40(1)
- Page 251 and 252:
246 ACKNOWLEDGEMENTS This research
- Page 253 and 254:
248 are now becoming more and more
- Page 255 and 256:
250 downstream control. Lam Chae re
- Page 257 and 258:
252 Kasetsart J. (Nat. Sci.) 40(1)
- Page 259 and 260:
254 Inflow (mcm.) Inflow (mcm.) Inf
- Page 261 and 262:
256 were above 0.70. The testing re
- Page 263 and 264:
258 1999-2000 could be used for tra
- Page 265 and 266:
Kasetsart J. (Nat. Sci.) 40 : 260 -
- Page 267 and 268:
262 we assume that r ≥ 2 and d r
- Page 269 and 270:
Kasetsart J. (Nat. Sci.) 40 : 264 -
- Page 271 and 272:
266 Figure 1 Prototype domains. num
- Page 273 and 274:
268 DISCUSSION Consequences indicat
- Page 275 and 276:
270 Kasetsart J. (Nat. Sci.) 40(1)
- Page 277 and 278:
272 George, B. K. 1997. The GIS Boo
- Page 279 and 280:
discussed; and appropriateness of t
- Page 281 and 282:
LITERATURE CITED FORMAT Manuscripts
- Page 283 and 284:
PRE-SUBMISSION CHECKLIST (see “In
- Page 285 and 286:
Send application materials to Payme
- Page 287:
Text and Journal Publication Co., L