
Create successful ePaper yourself
Turn your PDF publications into a flip-book with our unique Google optimized e-Paper software.
suggested by Saranwong et al., 2001). The PLS<br />
models developed from the above two selections<br />
of the band were compared.<br />
The PLS analyses in Table 3 showed that<br />
using the whole spectrum (1100 to 2500 nm) for<br />
establishing the PLS model gave the highest error<br />
in prediction (SEP=1.05) but the bias was low.<br />
This was probably due to the inclusion of<br />
interference or unwanted absorbance in the model.<br />
The second PLS model took the starting wavelenth<br />
at 1600 nm and the ending wavelength in the range<br />
at 2500 nm. Both terminal wavelengths were<br />
empirically taken from the first (1686 nm) and the<br />
last wavelengths (2486 nm) of the MLR model.<br />
The accuracy in prediction of the second PLS<br />
model was slightly improved (SEP = 1.00) over<br />
the first model. However the bias was poorer at<br />
–0.34.<br />
CONCLUSION<br />
Prediction of protein content in<br />
laboratorily prepared shrimp feed was achieved<br />
using NIR spectroscopy. The MLR model was<br />
optimal when pretreated with MSC and the MSC<br />
treated spectra at 1686 nm was involved in the<br />
model. The spectra band at 1686 nm was<br />
coincident with the dominant band of L-Glutamic<br />
acid which was the protein type accounting to the<br />
maximum proportion in the shrimp feed.<br />
Similarly, MSC treatment resulted in the optimum<br />
PLS model. Comparative investigation for the<br />
optimum spectral range for PLS analysis was<br />
conducted. The results indicated that the range<br />
between 1600 nm and 2500 nm was the optimum<br />
range in establishing the PLS model with the<br />
Kasetsart J. (Nat. Sci.) 40(1) 179<br />
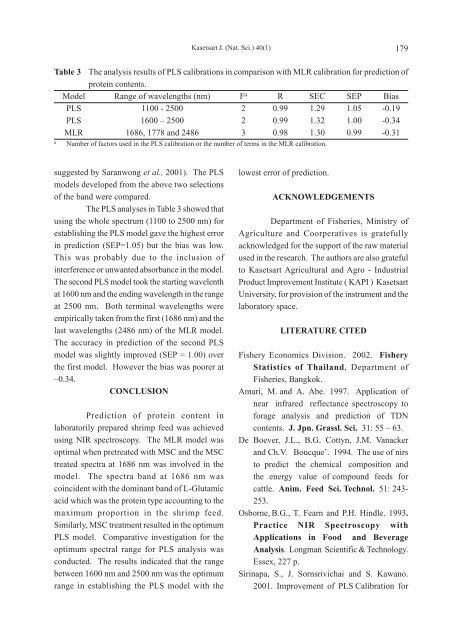
Table 3 The analysis results of PLS calibrations in comparison with MLR calibration for prediction of<br />
protein contents.<br />
Model Range of wavelengths (nm) Fa R SEC SEP Bias<br />
PLS 1100 - 2500 2 0.99 1.29 1.05 -0.19<br />
PLS 1600 – 2500 2 0.99 1.32 1.00 -0.34<br />
MLR 1686, 1778 and 2486 3 0.98 1.30 0.99 -0.31<br />
a Number of factors used in the PLS calibration or the number of terms in the MLR calibration.<br />
lowest error of prediction.<br />
ACKNOWLEDGEMENTS<br />
Department of Fisheries, Ministry of<br />
Agriculture and Coorperatives is gratefully<br />
acknowledged for the support of the raw material<br />
used in the research. The authors are also grateful<br />
to Kasetsart Agricultural and Agro - Industrial<br />
Product Improvement Institute ( KAPI ) Kasetsart<br />
University, for provision of the instrument and the<br />
laboratory space.<br />
LITERATURE CITED<br />
Fishery Economics Division. 2002. Fishery<br />
Statistics of Thailand, Department of<br />
Fisheries, Bangkok.<br />
Amari, M. and A. Abe. 1997. Application of<br />
near infrared reflectance spectroscopy to<br />
forage analysis and prediction of TDN<br />
contents. J. Jpn. Grassl. Sci. 31: 55 – 63.<br />
De Boever, J.L., B.G. Cottyn, J.M. Vanacker<br />
and Ch.V. Boucque’. 1994. The use of nirs<br />
to predict the chemical composition and<br />
the energy value of compound feeds for<br />
cattle. Anim. Feed Sci. Technol. 51: 243-<br />
253.<br />
Osborne, B.G., T. Fearn and P.H. Hindle. 1993.<br />
Practice NIR Spectroscopy with<br />
Applications in Food and Beverage<br />
Analysis. Longman Scientific & Technology.<br />
Essex, 227 p.<br />
Sirinapa, S., J. Sornsrivichai and S. Kawano.<br />
2001. Improvement of PLS Calibration for