
Create successful ePaper yourself
Turn your PDF publications into a flip-book with our unique Google optimized e-Paper software.
eservoir forecasting models A, B, C and D which<br />
used the same levels of input data to the single<br />
reservoir model. The multi-reservoir model<br />
utilized more information on cross correlation<br />
coefficients among the reservoir inflow which was<br />
one of the advantages. However, the multireservoir<br />
model required more computational time<br />
than the single reservoir model for training. The<br />
detail input variables of ANNs reservoir<br />
forecasting models A, B, C and D are shown in<br />
Table 3.<br />
Training and testing of ANNs forecasting model<br />
The multi-layer feed forward neural<br />
networks with back propagation algorithm was<br />
selected for this study. Sigmoid transfer function<br />
was used in all the models. The initial weight (IW),<br />
momentum (M) and learning rate (LR) were<br />
initially set between 0.80-0.90. The number of<br />
epochs for training varied between 10,000 to<br />
100,000 depending on the performance efficiency<br />
(R 2 ) of the training. There were no fixed rules for<br />
designing the structures of ANNs, number of<br />
hidden layers and number of neurons in hidden<br />
layers. Many times the best fit model was<br />
Kasetsart J. (Nat. Sci.) 40(1) 251<br />
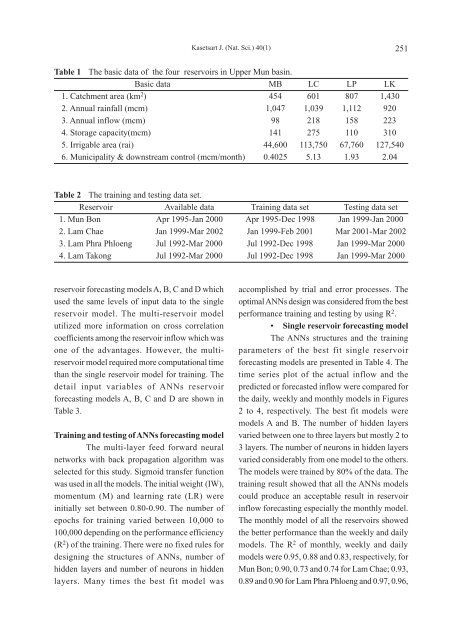
Table 1 The basic data of the four reservoirs in Upper Mun basin.<br />
Basic data MB LC LP LK<br />
1. Catchment area (km 2 ) 454 601 807 1,430<br />
2. Annual rainfall (mcm) 1,047 1,039 1,112 920<br />
3. Annual inflow (mcm) 98 218 158 223<br />
4. Storage capacity(mcm) 141 275 110 310<br />
5. Irrigable area (rai) 44,600 113,750 67,760 127,540<br />
6. Municipality & downstream control (mcm/month) 0.4025 5.13 1.93 2.04<br />
Table 2 The training and testing data set.<br />
Reservoir Available data Training data set Testing data set<br />
1. Mun Bon Apr 1995-Jan 2000 Apr 1995-Dec 1998 Jan 1999-Jan 2000<br />
2. Lam Chae Jan 1999-Mar 2002 Jan 1999-Feb 2001 Mar 2001-Mar 2002<br />
3. Lam Phra Phloeng Jul 1992-Mar 2000 Jul 1992-Dec 1998 Jan 1999-Mar 2000<br />
4. Lam Takong Jul 1992-Mar 2000 Jul 1992-Dec 1998 Jan 1999-Mar 2000<br />
accomplished by trial and error processes. The<br />
optimal ANNs design was considered from the best<br />
performance training and testing by using R 2 .<br />
• Single reservoir forecasting model<br />
The ANNs structures and the training<br />
parameters of the best fit single reservoir<br />
forecasting models are presented in Table 4. The<br />
time series plot of the actual inflow and the<br />
predicted or forecasted inflow were compared for<br />
the daily, weekly and monthly models in Figures<br />
2 to 4, respectively. The best fit models were<br />
models A and B. The number of hidden layers<br />
varied between one to three layers but mostly 2 to<br />
3 layers. The number of neurons in hidden layers<br />
varied considerably from one model to the others.<br />
The models were trained by 80% of the data. The<br />
training result showed that all the ANNs models<br />
could produce an acceptable result in reservoir<br />
inflow forecasting especially the monthly model.<br />
The monthly model of all the reservoirs showed<br />
the better performance than the weekly and daily<br />
models. The R 2 of monthly, weekly and daily<br />
models were 0.95, 0.88 and 0.83, respectively, for<br />
Mun Bon; 0.90, 0.73 and 0.74 for Lam Chae; 0.93,<br />
0.89 and 0.90 for Lam Phra Phloeng and 0.97, 0.96,