
You also want an ePaper? Increase the reach of your titles
YUMPU automatically turns print PDFs into web optimized ePapers that Google loves.
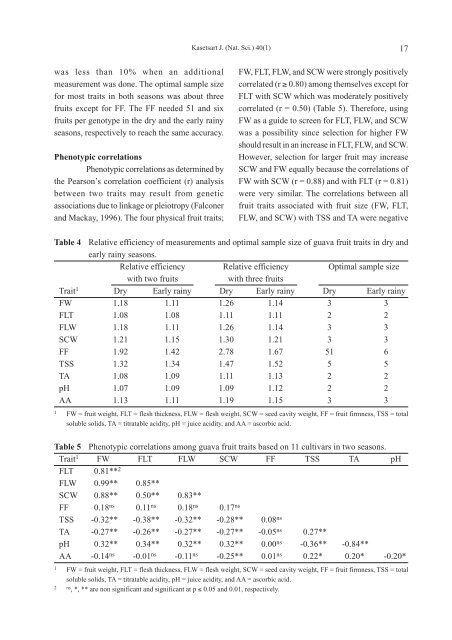
was less than 10% when an additional<br />
measurement was done. The optimal sample size<br />
for most traits in both seasons was about three<br />
fruits except for FF. The FF needed 51 and six<br />
fruits per genotype in the dry and the early rainy<br />
seasons, respectively to reach the same accuracy.<br />
Phenotypic correlations<br />
Phenotypic correlations as determined by<br />
the Pearson’s correlation coefficient (r) analysis<br />
between two traits may result from genetic<br />
associations due to linkage or pleiotropy (Falconer<br />
and Mackay, 1996). The four physical fruit traits;<br />
Kasetsart J. (Nat. Sci.) 40(1) 17<br />
FW, FLT, FLW, and SCW were strongly positively<br />
correlated (r ≥ 0.80) among themselves except for<br />
FLT with SCW which was moderately positively<br />
correlated (r = 0.50) (Table 5). Therefore, using<br />
FW as a guide to screen for FLT, FLW, and SCW<br />
was a possibility since selection for higher FW<br />
should result in an increase in FLT, FLW, and SCW.<br />
However, selection for larger fruit may increase<br />
SCW and FW equally because the correlations of<br />
FW with SCW (r = 0.88) and with FLT (r = 0.81)<br />
were very similar. The correlations between all<br />
fruit traits associated with fruit size (FW, FLT,<br />
FLW, and SCW) with TSS and TA were negative<br />
Table 4 Relative efficiency of measurements and optimal sample size of guava fruit traits in dry and<br />
early rainy seasons.<br />
Relative efficiency Relative efficiency Optimal sample size<br />
with two fruits with three fruits<br />
Trait 1 Dry Early rainy Dry Early rainy Dry Early rainy<br />
FW 1.18 1.11 1.26 1.14 3 3<br />
FLT 1.08 1.08 1.11 1.11 2 2<br />
FLW 1.18 1.11 1.26 1.14 3 3<br />
SCW 1.21 1.15 1.30 1.21 3 3<br />
FF 1.92 1.42 2.78 1.67 51 6<br />
TSS 1.32 1.34 1.47 1.52 5 5<br />
TA 1.08 1.09 1.11 1.13 2 2<br />
pH 1.07 1.09 1.09 1.12 2 2<br />
AA 1.13 1.11 1.19 1.15 3 3<br />
1 FW = fruit weight, FLT = flesh thickness, FLW = flesh weight, SCW = seed cavity weight, FF = fruit firmness, TSS = total<br />
soluble solids, TA = titratable acidity, pH = juice acidity, and AA = ascorbic acid.<br />
Table 5 Phenotypic correlations among guava fruit traits based on 11 cultivars in two seasons.<br />
Trait 1 FW FLT FLW SCW FF TSS TA pH<br />
FLT 0.81** 2<br />
FLW 0.99** 0.85**<br />
SCW 0.88** 0.50** 0.83**<br />
FF 0.18 ns 0.11 ns 0.18 ns 0.17 ns<br />
TSS -0.32** -0.38** -0.32** -0.28** 0.08 ns<br />
TA -0.27** -0.26** -0.27** -0.27** -0.05 ns 0.27**<br />
pH 0.32** 0.34** 0.32** 0.32** 0.00 ns -0.36** -0.84**<br />
AA -0.14 ns -0.01 ns -0.11 ns -0.25** 0.01 ns 0.22* 0.20* -0.20*<br />
1 FW = fruit weight, FLT = flesh thickness, FLW = flesh weight, SCW = seed cavity weight, FF = fruit firmness, TSS = total<br />
soluble solids, TA = titratable acidity, pH = juice acidity, and AA = ascorbic acid.<br />
2 ns , *, ** are non significant and significant at p ≤ 0.05 and 0.01, respectively.